Alex1Powell Categories Economy

1/14
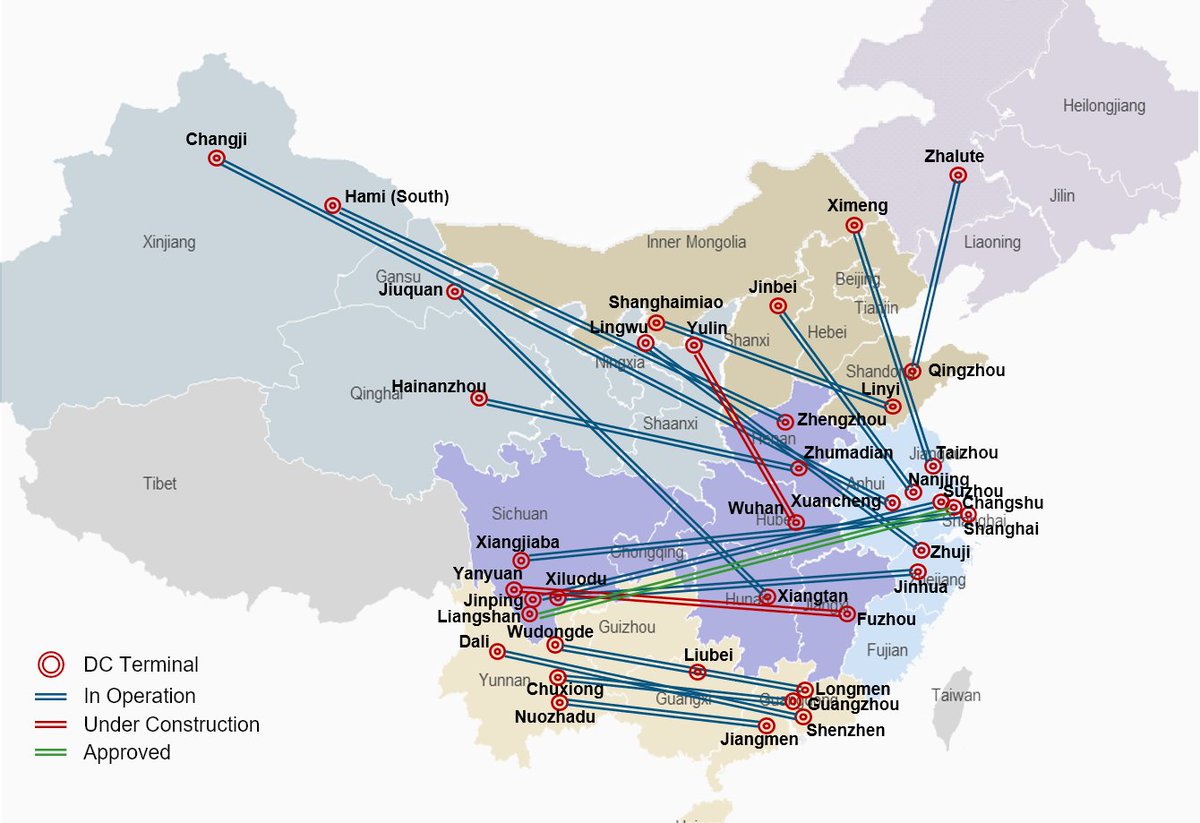
China is building the world's most advanced UHV grid right now.
UHV lines are good for carrying power over long distances. The high voltage level reduces line loss. But they are very expensive to build.
China's UHVDC Network now:
2/14
In the rest of the world, UHV lines have generally been used sparingly. Submarine power cables (e.g. connecting UK to mainland Europe) and some huge hydropower projects in Quebec are some notable exceptions.
China is building UHV lines on a scale never seen before.
3/14
So why is China different? Geography plays a huge role. China's load centers are in the coastal East and South, while the best wind, solar, and hydro resources are in the North, Northwest, and Southwest. Power (esp. RE) is being generated far from where it's needed most.
4/14
In the past, poor regional interconnectivity has been a big contributor to low offtake levels of renewable energy. Of course a glut of coal power also played a role. Curtailment has improved in recent yrs tho. I discussed regional grids before:
China Power Sector For Dummies- Part 1: Grids and Dispatch - Getting Smarter
— David F. (@pretentiouswhat) August 18, 2020
1/10
First, Chinese doesn't have a national grid, at least not in the way that small countries do. There are 6 regional grids (N, NE, NW, E, C, S). State Grid runs 5 of them and Southern Grid runs 1.
5/14
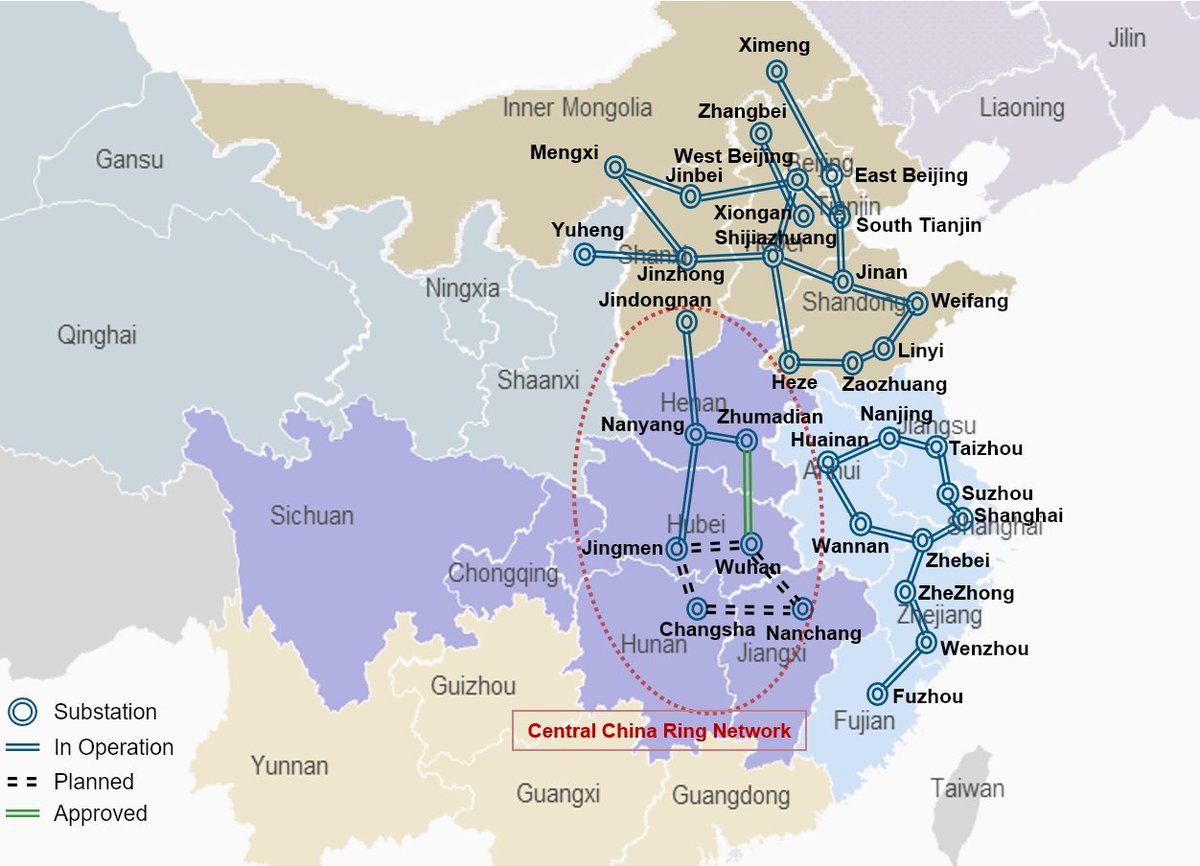
UHV lines provide a inter-region backbone to transport power hundreds or thousands of km across the country. The UHVDC lines are used for the longest distances, while UHVAC lines are used for shorter distances, often within the same regional grid.
China's UHVAC lines now:


Easy as ABC. How to do it.
[THREAD]⚠️
#LockdownLevel3
#Bushiri
#RamaphosaChallenge
Go online to the website of CIPC and register a new company for R175, registration is R125 and the name is R50.
Go to https://t.co/RJcCHvdgCl which is the easiest website vision for CIPC.


https://t.co/hmAz0tsyuv
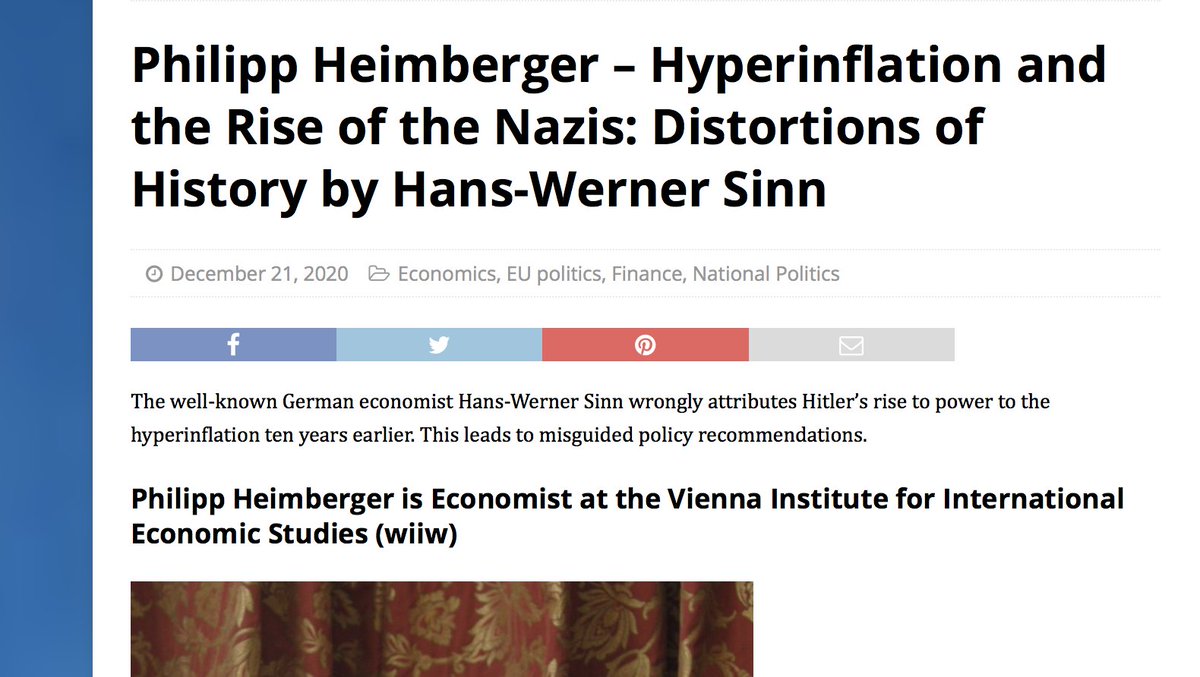
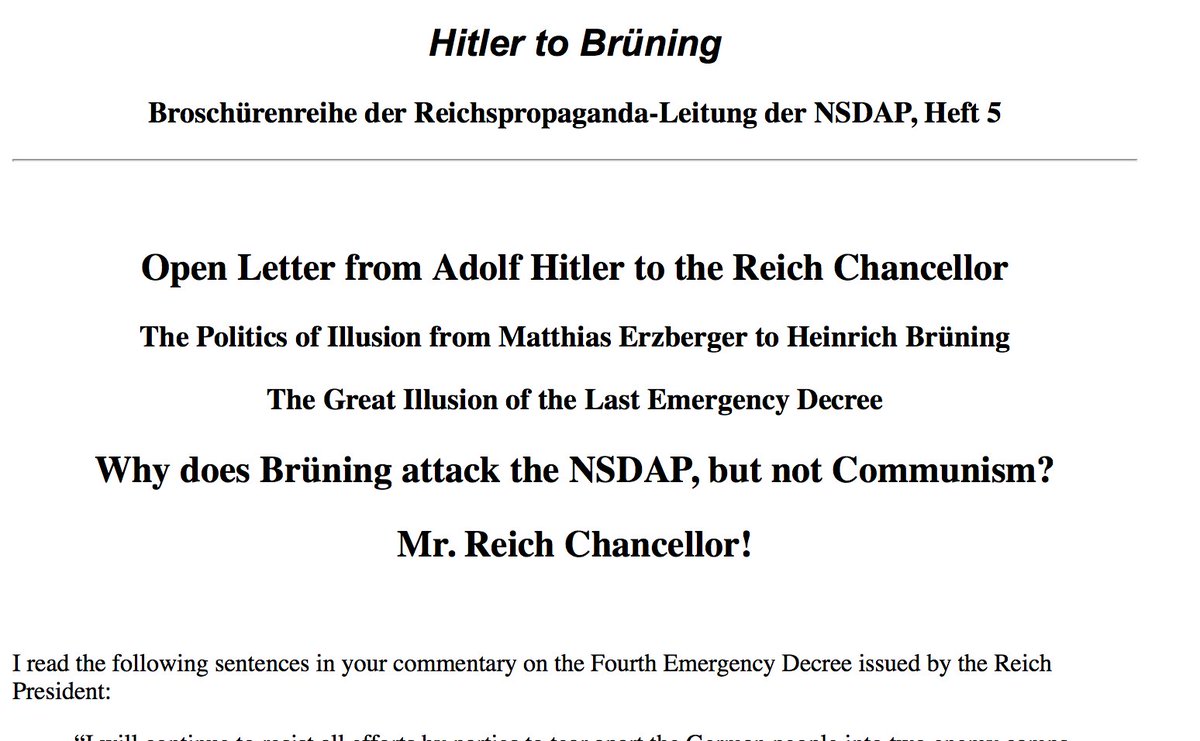
Sinn says hyperinflation after WW1 impoverished the German middle class in the Weimar Republic: "Ten years later they elected Adolf Hitler as Reich Chancellor." Policy recommendation today against hyperinflation: "tighter budget constraints" /2
https://t.co/ydfxgiCpkD
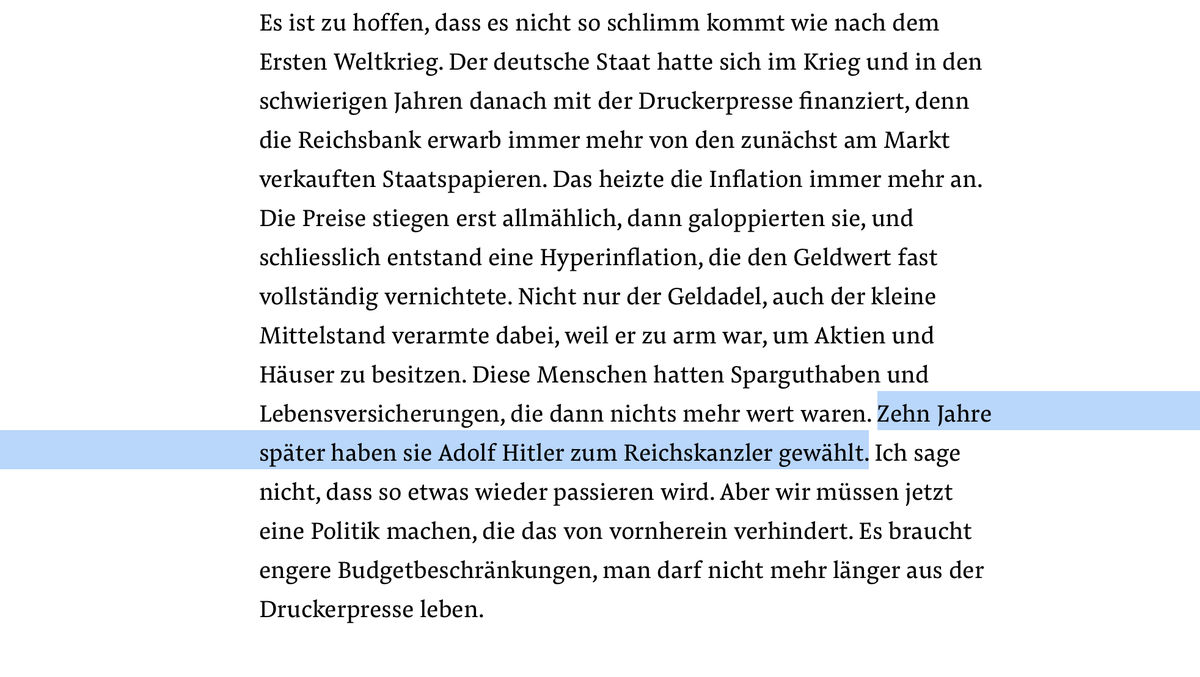
Sinn thus feeds a widespread misinterpretation. Mass poverty when the Nazis came to power in 1933 was not the result of hyperinflation, which at that time was ten years in the past; it was primarily a consequence of mass unemployment due to the recession in the early 1930s. /3
The Nazis had come to power after years of deflation - i.e. falling prices. From 1930 onwards, Reich Chancellor Brüning used emergency decrees to bring about tax increases and drastic state spending cuts that pierced the social safety net. /4
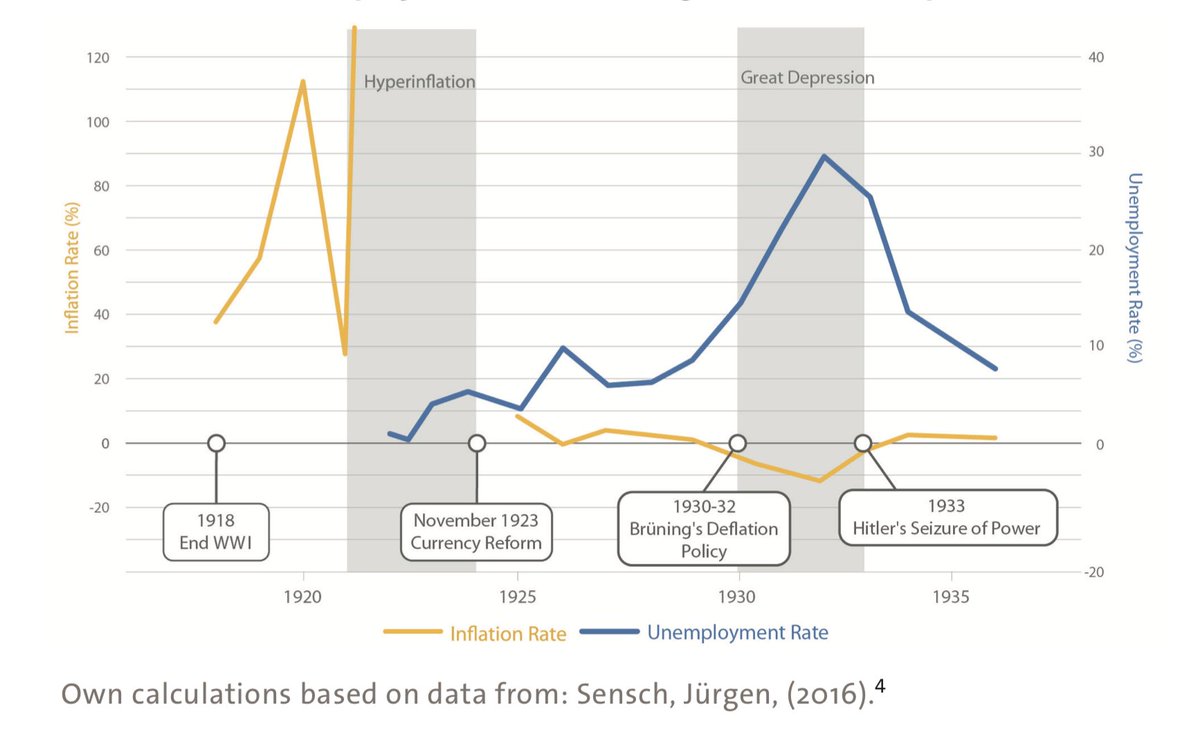
Austerity policies increased unemployment, led to social suffering and unrest. Hitler realised by the end of 1931 at the latest that Brüning's austerity policy would "help his party to victory and thus end the illusions of the present system." /5
https://t.co/yRN6hseciX


Obviously a longtime Disney D2C bull; I was astounded, shocked by slate's quality, range, volume.
This is Disney going beyond a digital "Vault" plus originals. It is saying all of your favorite stories, more,
This feels like the true unveiling of Disney+ versus April 2019, tbh
— Matthew Ball (@ballmatthew) December 10, 2020
2/ Not just a stronger Disney+, but one that hugely raises the tablestakes of competition, growth, press coverage, notability.
Paramount+ plans new Star Trek year round. Feels quaint now. Peacock will have a Jurassic Park + Fast series eventually.
In other words, the year-long Disney+ Open Beta attracted 87M subscribers.
— Chris Lacy (@chrismlacy) December 10, 2020
3/ In "Content, Cars, and Comparisons in the 'Streaming Wars'", I wrote about how Disney $1B in content spend gets several billion of equivalent spend through its resonance
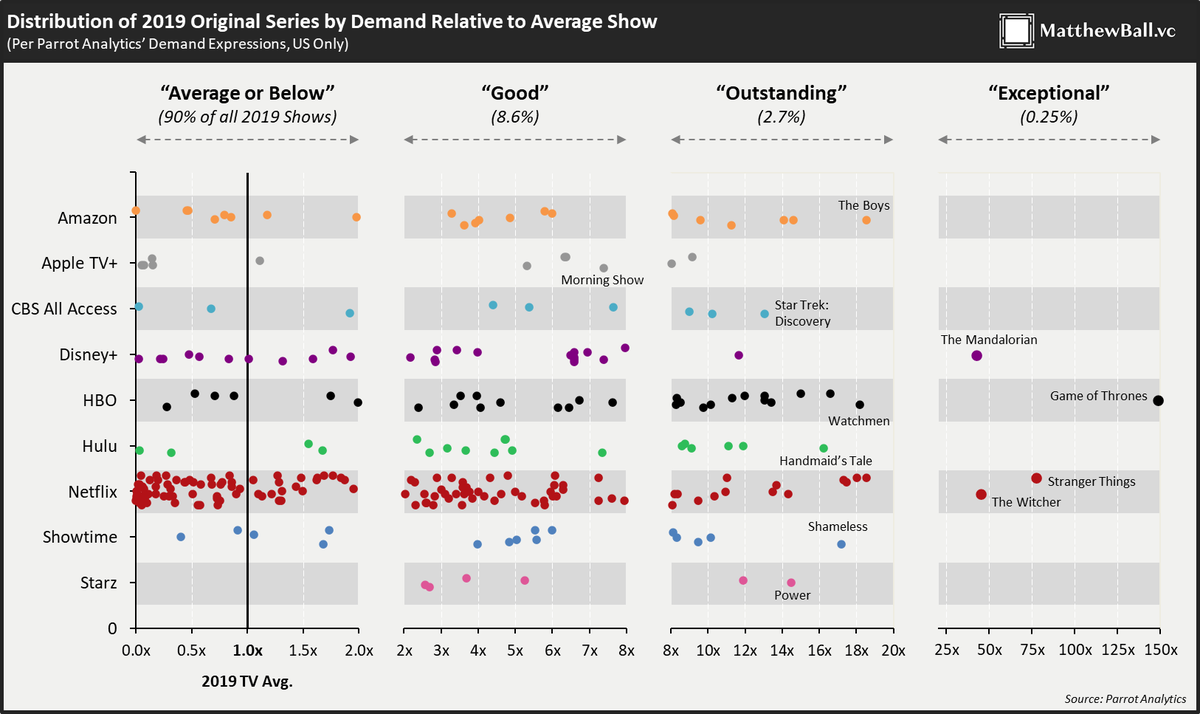
Mando was a top 5 show per @ParrotAnalytics in 2019. Disney thinks it can have 10 "Top 5s" a year.
4/ Trade talk can be misleading, but it takes only a cursory look at Twitter, the most popular shows of the past decade (Walking Dead, Thrones, Mando, Stranger Things), Disney's dominance at the box office (8 of top 10 in 2019) and wonder how to beat
A former exec at a global media giant: "This is how the game is now played. If other companies want to compete, this is now the threshold... it's a kind of cultural shock and awe" (With permission)
— Matthew Ball (@ballmatthew) December 11, 2020
5/ Roadmap doesn't just suck oxygen out of streaming wars (as Netflix did from 2014-18), it will enable Disney+ to rapidly grow its price
If I pay $54 a year to use Disney+ for 2 months, what happens when it's year-round?
Worth $15 month in
I pay $27 per month for Disney+. This is the biggest bull thesis for Disney.
— Matthew Ball (@ballmatthew) November 14, 2020


Here's the thread about "membranes" as a metaphor for groups of people.
15/ One metaphor I've heard people use for regulating group dynamics is of a cell membrane
— Malcolm is back by the \U0001f30ecean! (@Malcolm_Ocean) December 21, 2020
(what's my prompt again? "Spatial metaphors for human systems" ...idk what counts as spatial - everything's pretty spatial to me. I guess I'll avoid computer stuff tho\u2014doing great so far)
15a/ Membranes. Monists go on about how everything is one, which is true in a sense but also have you noticed that some things are inside and some things are outside? The role of skin, or the walls of a house, or a windshield on a car, is it keeps inside in & outside out.
15b/ Membranes can be applied to groups, and we can talk about a few different kinds of membranes that you might see around a particular group of people:
- closed membrane
- closed web
- semipermeable membrane
- open network
15c/ Closed Membrane: eg a company, family or country. Maybe a way to join it, but you need an active & explicit invitation by the members, whether that’s a job application or a marriage or an immigration process. Lots of intentional community houses are also like this.
15d/ Closed Web: consider a friend group. You don't exactly need an invitation from everyone in the group to join, but you do need to make friends with *someone* in the group. Polycules (except polyfidelity) work similarly, usually.


Falls of Rome & Tang in 1st millennium were worse, but at least they were recorded. Records of the even worse Bronze Age Collapse around 1200 BC barely survived for some areas, & for other regions all we have are archaeological indications that they regressed to the stone age.
Bronze Age Collapse & resultant trade breakdown led to cession of bronze production in the Don River Basin. Locals reverted to stone & bone tools, then figured out how to make iron tools. Their neighbors adopted iron over the next few centuries. pic.twitter.com/HoDk52cLuH
— Nemets (@Peter_Nimitz) August 29, 2020
Further back in the 3rd millennium BC, an even worse series of catastrophes occurred - the Indo-European invasions - ending the Megalith Builder Civilization with their urban settlements & leaving much of Europe depopulated for 600 years.
There are no traces of permanent Corded Ware settlements anywhere - strongly supporting that they were nomadic cattle herders. Only after Bell Beaker arrival in 2300 BC do sedentary agricultural settlements return. pic.twitter.com/GkPluSgbbt
— Nemets (@Peter_Nimitz) May 3, 2020
By the time of their destruction the Megalith Builders themselves had been in a centuries long decline from their Golden Age in late 5th & early 4th millennium. Their great realms had likely disintegrated around 3500 BC into smaller chiefdoms engaging in endemic warfare.
Shennan: massive EEF population growth in Ireland 4000-3600 BC, followed by population decline & reforestation 3600-3400 BC. pic.twitter.com/HksEl16OjH
— Nemets (@Peter_Nimitz) June 18, 2020
The Megalith Builders themselves were the result of WHG chieftains overthrowing the decadent EEF chiefs like those of the Linear Ceramics around 4400 BC & subjugating an 1800 year old neolithic civilization. Possibly related to spread of copper-working.
Resurgence of Hunter-Gatherer ancestry in Copper Age Balkan EEF populations of mid 4000s & return of hunter-gatherers cultural customs. EEF Cucuteni\u2013Trypillians experienced this too - were 80% EEF, 10% EHG, 10% WHG in ancestry, showing they mixed with local HGs. pic.twitter.com/Tqf5yoc99U
— Nemets (@Peter_Nimitz) July 26, 2020