Categories Screeners
7 days
30 days
All time
Recent
Popular


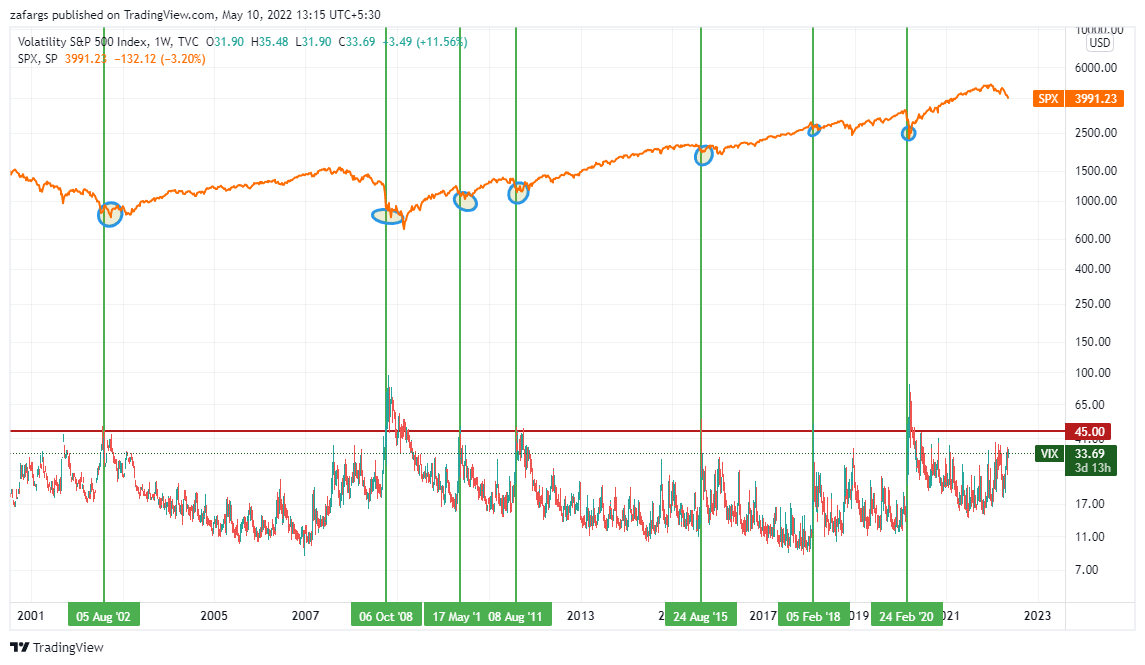
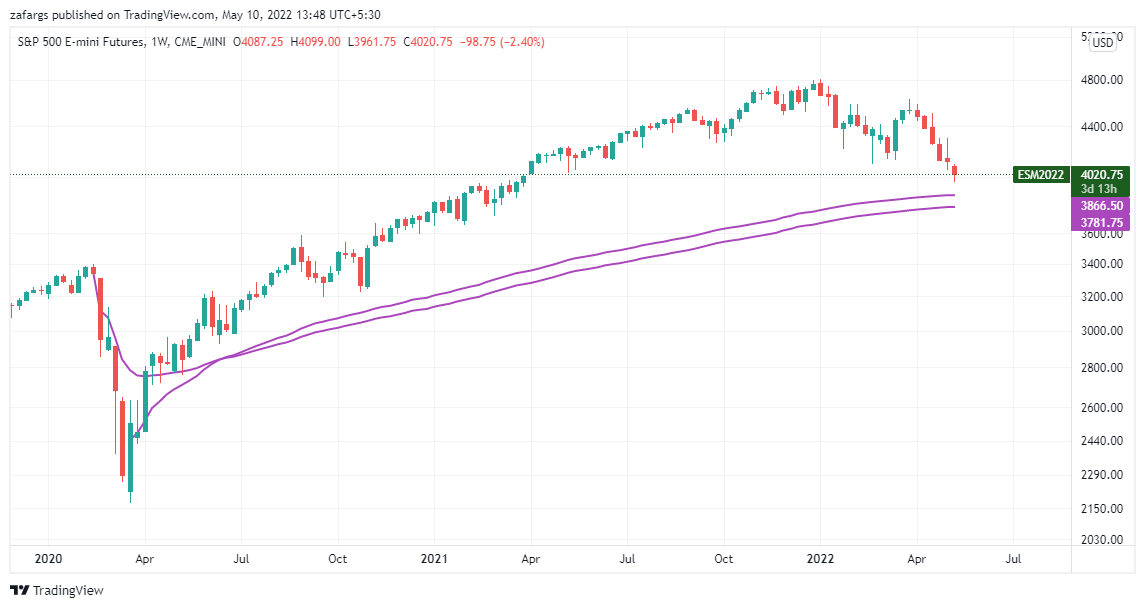


How to know bottom formed?
As per classical tech analysis
Whenever daily RSI starts trading above weekly RSI. Consider it as short term bottom
When weekly RSI, above monthly RSI midium term bottom
Now daily RSI 30
Weekly 37
Monthly 59
@bankniftydoctor ..RSI king.view pl
As per classical tech analysis
Whenever daily RSI starts trading above weekly RSI. Consider it as short term bottom
When weekly RSI, above monthly RSI midium term bottom
Now daily RSI 30
Weekly 37
Monthly 59
@bankniftydoctor ..RSI king.view pl
I will do either
— Discipline TrendFollower\U0001f600 (@SouravSenguptaI) March 7, 2022
1.Monthly RSI near 40 ( presently 58)..Did nearly 20 yr backtesting
Or
2 A close above 17350 ( monthly)..This will confirm HH Structure
Levels r as of now


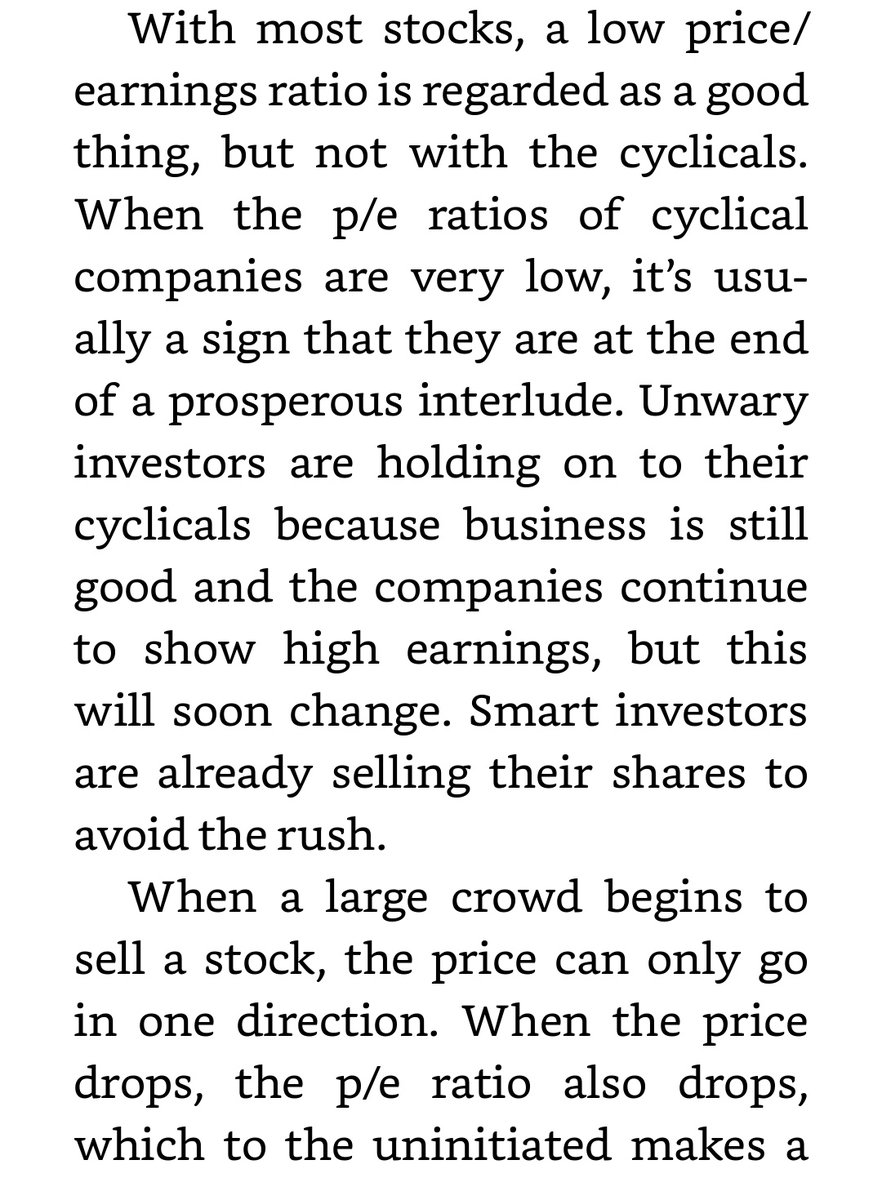

When trending, especially above #movingaverage, ignore this behaviour of #MACD .
I use MACD for reversal points only.
Do not follow it at every 5 minute.
I use MACD for reversal points only.
Do not follow it at every 5 minute.
Yesterday and today both we had MACD divergence . Yet market was just continuing in the opposite direction . Can you please what to do in such case ? . For eg - today I was unable to go long because there was divergence . Same case was for yesterday . Can you please guide .\U0001f64f pic.twitter.com/vfqy8dRAU2
— Mehul (@MehulGarodia9) May 20, 2022

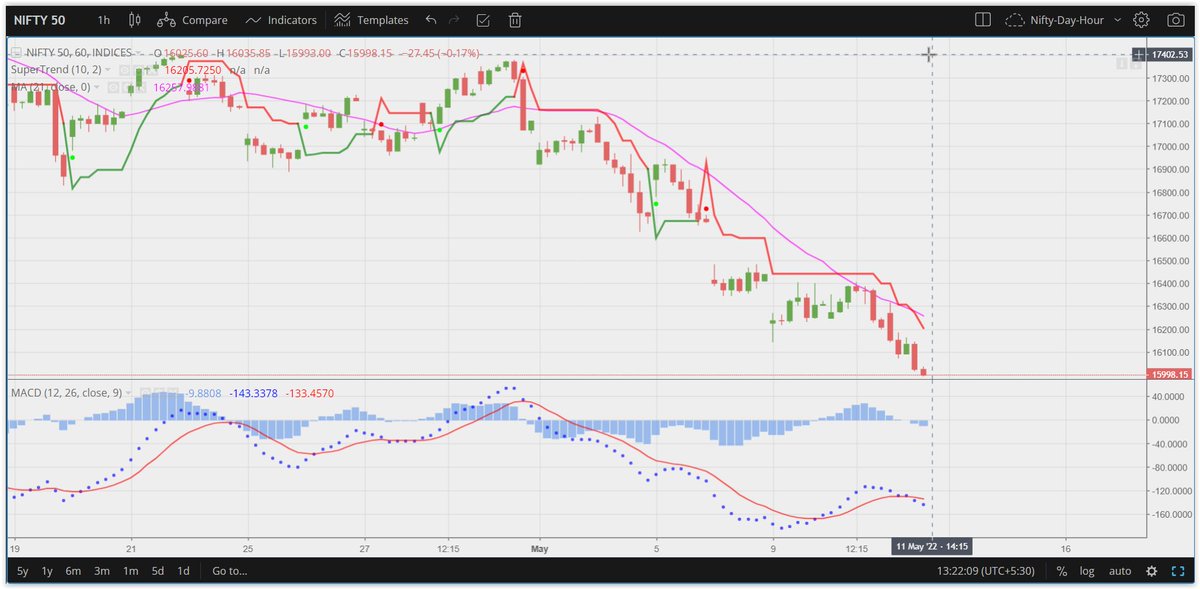



Cyclical stocks (metals, commodities, even auto) have the lowest PE multiples right around the top when cycle is about to turn.
That's when they suck in the retail.
That's when they suck in the retail.
50 % drawdown in sail done from high of 150 to 75 now.
— Sandeep M (@Sandeep_Majjigi) May 23, 2022
Without knowing how to play the cyclicals one would lose a lot of money there looking at pe ratio in single digit.