Categories Screeners
7 days
30 days
All time
Recent
Popular
How to know bottom formed?
As per classical tech analysis
Whenever daily RSI starts trading above weekly RSI. Consider it as short term bottom
When weekly RSI, above monthly RSI midium term bottom
Now daily RSI 30
Weekly 37
Monthly 59
@bankniftydoctor ..RSI king.view pl
As per classical tech analysis
Whenever daily RSI starts trading above weekly RSI. Consider it as short term bottom
When weekly RSI, above monthly RSI midium term bottom
Now daily RSI 30
Weekly 37
Monthly 59
@bankniftydoctor ..RSI king.view pl
I will do either
— Discipline TrendFollower\U0001f600 (@SouravSenguptaI) March 7, 2022
1.Monthly RSI near 40 ( presently 58)..Did nearly 20 yr backtesting
Or
2 A close above 17350 ( monthly)..This will confirm HH Structure
Levels r as of now
25Sma in "15 min. t/f" is same as 75 Sma in "5 min. t/f" which we use as 1 Day average
Earlier chart in 5 Min. t/f with 75Sma
Relate oscillator movement to #priceaction & you'll notice price rise as "corrective" based on the feeble rise compared to indicator's rise except once. https://t.co/Tt1kD3iPlY
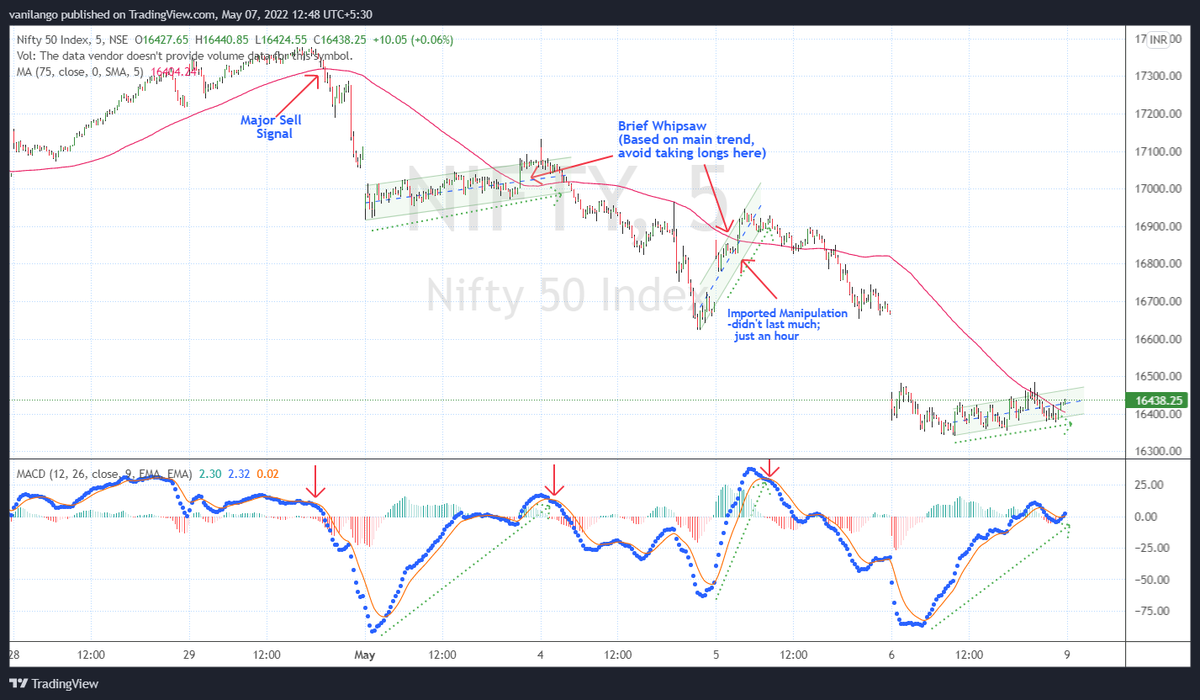
Earlier chart in 5 Min. t/f with 75Sma
Relate oscillator movement to #priceaction & you'll notice price rise as "corrective" based on the feeble rise compared to indicator's rise except once. https://t.co/Tt1kD3iPlY

Good afternoon master,
— Sunny Singh (@SurendraSinghJi) May 7, 2022
What does sma 5 means with 25 ma as seen in this chart.
How to use it with macd master?
Already following systems that i learned from you.
Want to add another learning from this.
Keep blessings master \U0001f64f


