
52 week Breakout Screener Explained
More from JayneshKasliwal




A mega thread to understand the Use of 21 , 50 and 200 ema.
4 Effective uses of Exponential Moving Averages !
Retweet and Share 🔄
#stockmarkets #nifty
@kuttrapali26 @caniravkaria
Once Can refer the use of Moving Averages Throught this thread
ULTIMATE GUIDE TO 21 and 200 Moving Average
— JayneshKasliwal (@JayneshKasliwal) November 14, 2021
SUNDAY THREAD \U0001f516
A trend Following System That will Help You Improve Trading immensely.
RETWEET AND SHARE \U0001f504@kuttrapali26 @AmitabhJha3 #stocks #StockMarket
1/n
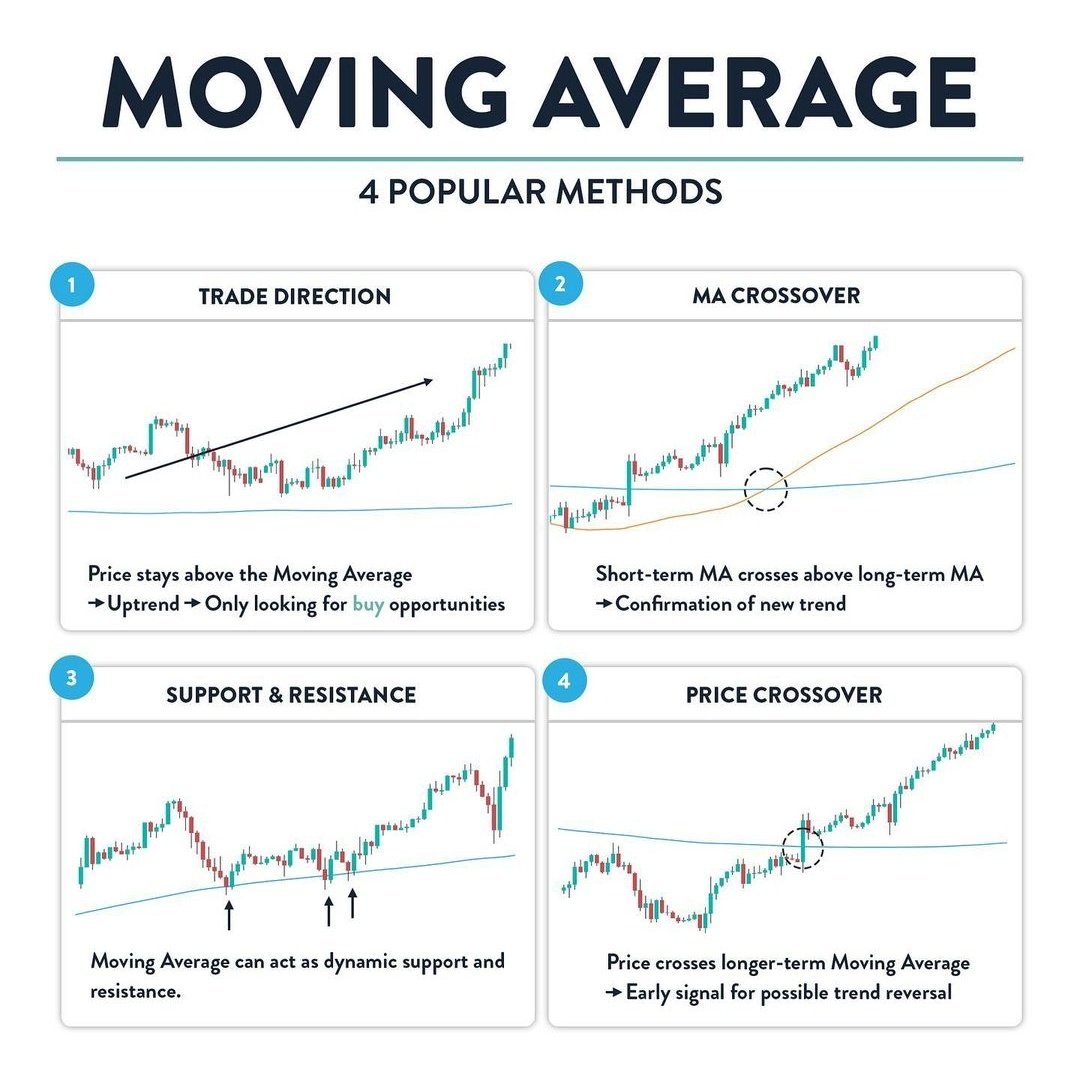
4 Popular uses of moving averages
1. Identifying the direction of trend
2. MA crossover
3. Dynamic Support and Resistance
4. Price Crossing above Key EMAs
Note : In chart 21 ema is red , 50 ema is green and 200 ema is black
2/n
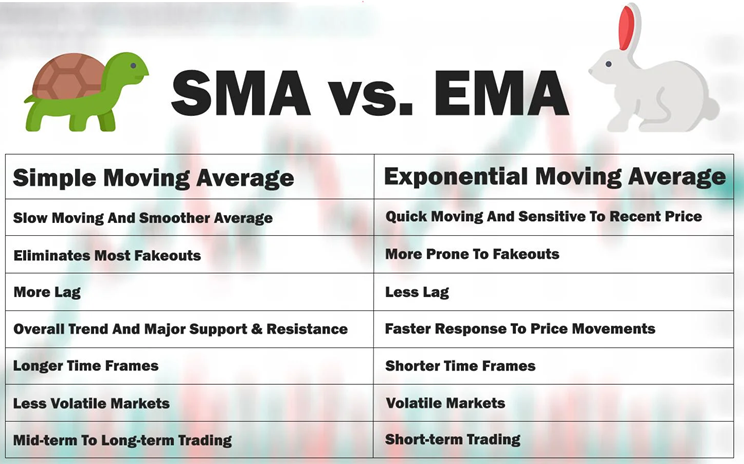
Why EMA and not SMA ?
EMA is fast , accurate and prices in recent data !
3/n
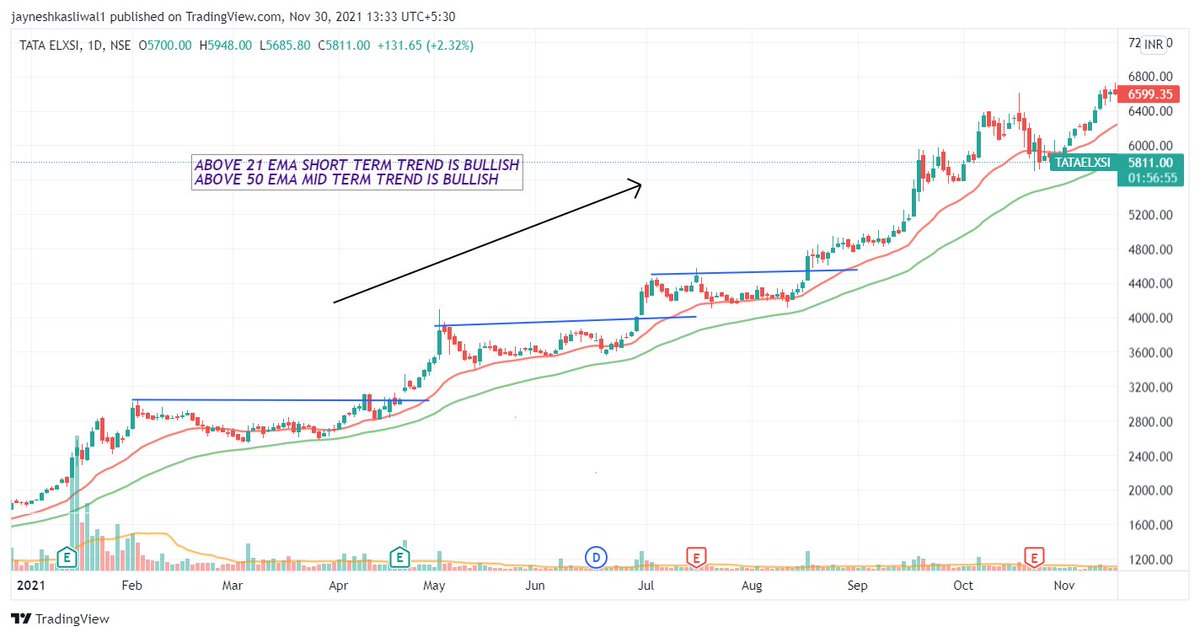
Use 1 : Identifying the trend of stock on dtf
The 21 ema will tell us the Short term trend of a stock , while the 200 ema will tell us the long term trend of a stocks
Any EMA that is sloping
:upwards trend is BULLISH
:sideways trend is NEUTRAL
:downwards trend is BEARISH
4/n

More from Screeners




You May Also Like


To me, the most important aspect of the 2018 midterms wasn't even about partisan control, but about democracy and voting rights. That's the real battle.
2/The good news: It's now an issue that everyone's talking about, and that everyone cares about.
3/More good news: Florida's proposition to give felons voting rights won. But it didn't just win - it won with substantial support from Republican voters.
That suggests there is still SOME grassroots support for democracy that transcends
4/Yet more good news: Michigan made it easier to vote. Again, by plebiscite, showing broad support for voting rights as an
5/OK, now the bad news.
We seem to have accepted electoral dysfunction in Florida as a permanent thing. The 2000 election has never really
Bad ballot design led to a lot of undervotes for Bill Nelson in Broward Co., possibly even enough to cost him his Senate seat. They do appear to be real undervotes, though, instead of tabulation errors. He doesn't really seem to have a path to victory. https://t.co/utUhY2KTaR
— Nate Silver (@NateSilver538) November 16, 2018

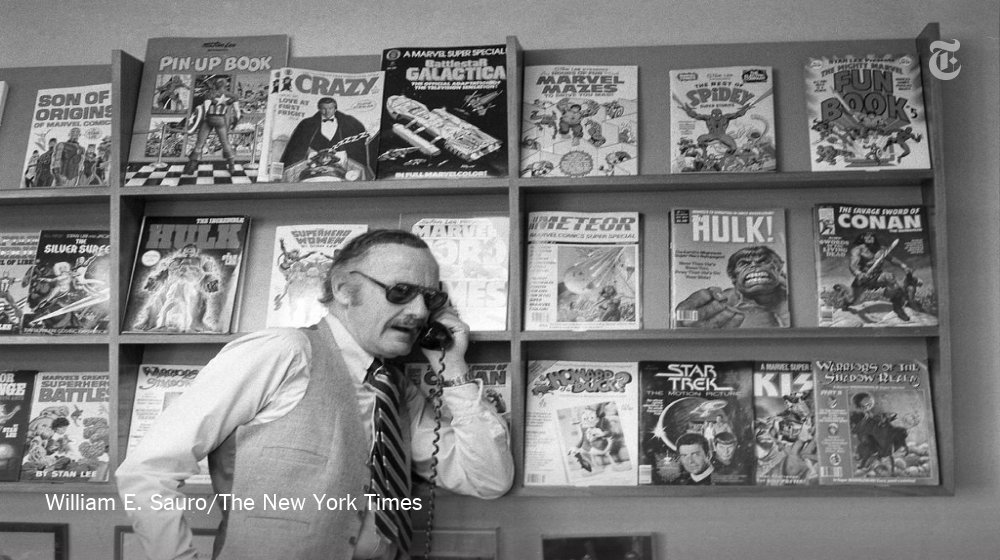
Stan Lee, who died Monday at 95, was born in Manhattan and graduated from DeWitt Clinton High School in the Bronx. His pulp-fiction heroes have come to define much of popular culture in the early 21st century.
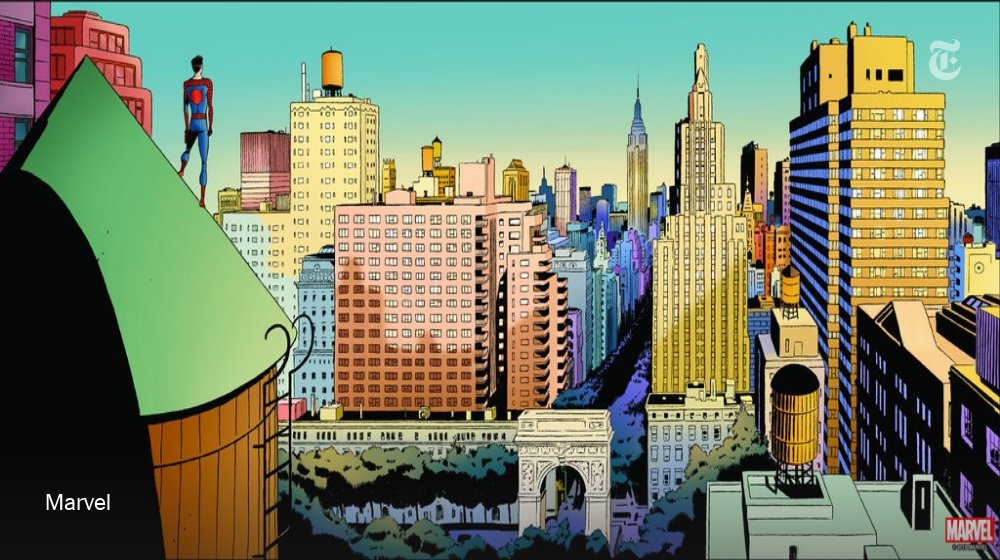
Tying Marvel’s stable of pulp-fiction heroes to a real place — New York — served a counterbalance to the sometimes gravity-challenged action and the improbability of the stories. That was just what Stan Lee wanted. https://t.co/rDosqzpP8i
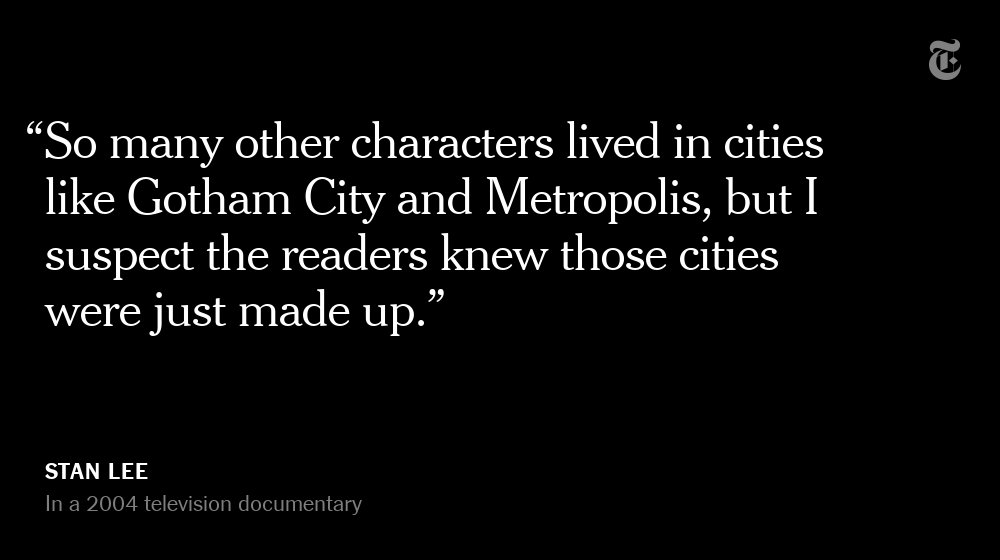
The New York universe hooked readers. And the artists drew what they were familiar with, which made the Marvel universe authentic-looking, down to the water towers atop many of the buildings. https://t.co/rDosqzpP8i
The Avengers Mansion was a Beaux-Arts palace. Fans know it as 890 Fifth Avenue. The Frick Collection, which now occupies the place, uses the address of the front door: 1 East 70th Street.

If everyone was holding bitcoin on the old x86 in their parents basement, we would be finding a price bottom. The problem is the risk is all pooled at a few brokerages and a network of rotten exchanges with counter party risk that makes AIG circa 2008 look like a good credit.
— Greg Wester (@gwestr) November 25, 2018
The benign product is sovereign programmable money, which is historically a niche interest of folks with a relatively clustered set of beliefs about the state, the literary merit of Snow Crash, and the utility of gold to the modern economy.
This product has narrow appeal and, accordingly, is worth about as much as everything else on a 486 sitting in someone's basement is worth.
The other product is investment scams, which have approximately the best product market fit of anything produced by humans. In no age, in no country, in no city, at no level of sophistication do people consistently say "Actually I would prefer not to get money for nothing."
This product needs the exchanges like they need oxygen, because the value of it is directly tied to having payment rails to move real currency into the ecosystem and some jurisdictional and regulatory legerdemain to stay one step ahead of the banhammer.
