The Darvas Box Trading Strategy
A Detailed Thread 🔖 + 1 Book Give Away !

Rules For Giveaway :
Follow @JayneshKasliwal
🔄Retweet and
♥️ Like this Tweet
One Lucky Winner will be Selected
#StockMarket #darvasbox

About Darvas :
In the late 1950s, Nicolas Darvas was one half of the highest paid dance team in show business.
Darvas turned a $36,000 investment into more than $2.25 million in a three-year period.
1/n
It was on a two-year tour of the world that he initially developed his ‘Darvas Box’ method of screening stocks – a method of picking stocks based on the stock’s price and volume .

Read more About his life : https://t.co/58HCN9ddDG
2/n
@kuttrapali26
Trading Style :
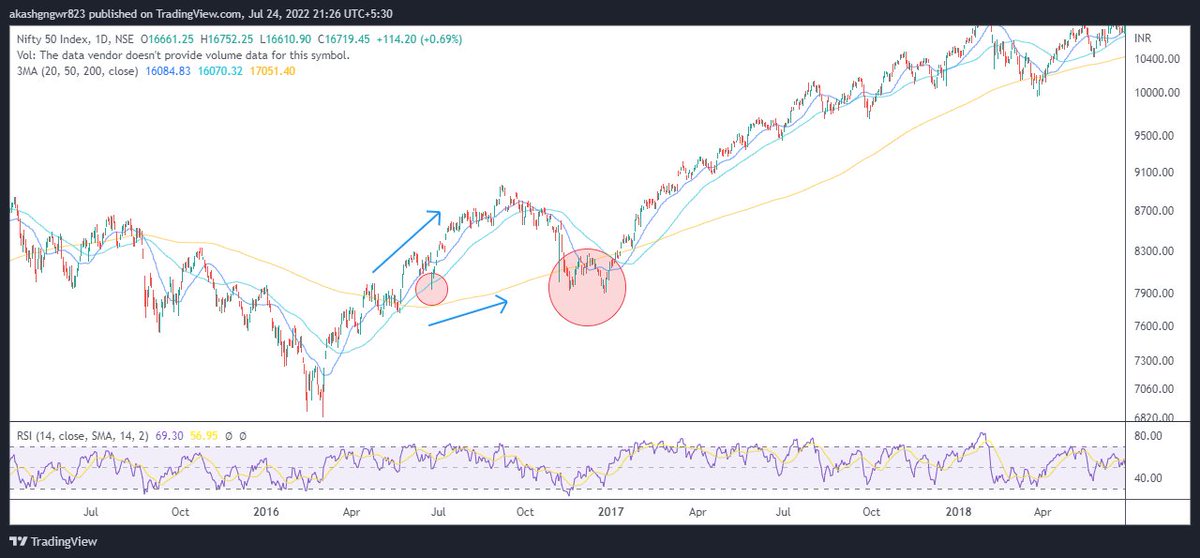
TREND FOLLOWING MOMENTUM TRADING
📌Darvas was tracking stocks only making new high
Trading stocks breaking 2-3 year high.
📌But 52-week high is mostly tracked for this theory
📌Emphasized very much on Huge volume Breakouts

A typical Darvas Box Chart :
3/n
Rules to Follow :
Stock Price Should be within 15 to 20 % of Highs
Overall trend of the stocks should be up and greater than 200 ema
Preferably 100% up then the 52 week low
Look for Industry Leaders , with High Growth
4/n
How to Trade ?
📌Whenever the stocks breaks the 52 week Keep them on watchlist
📌Look that The next 3 candles should not break the 52 week high and fall below
📌The high point will be called as CEILING
📌Look for Volume Breakout too or Breakout should be Above Average volume
5/n
Floor: Stoploss
📌Floor is basically the a small reversal point or bottom the stock is trying to make.
📌Floor is generally the stoploss of the trade
📌The bigger the range the bigger the stoploss and higher the Risk
6/n
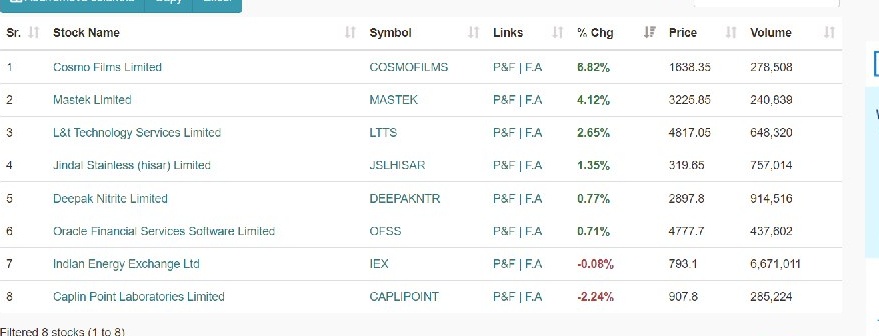
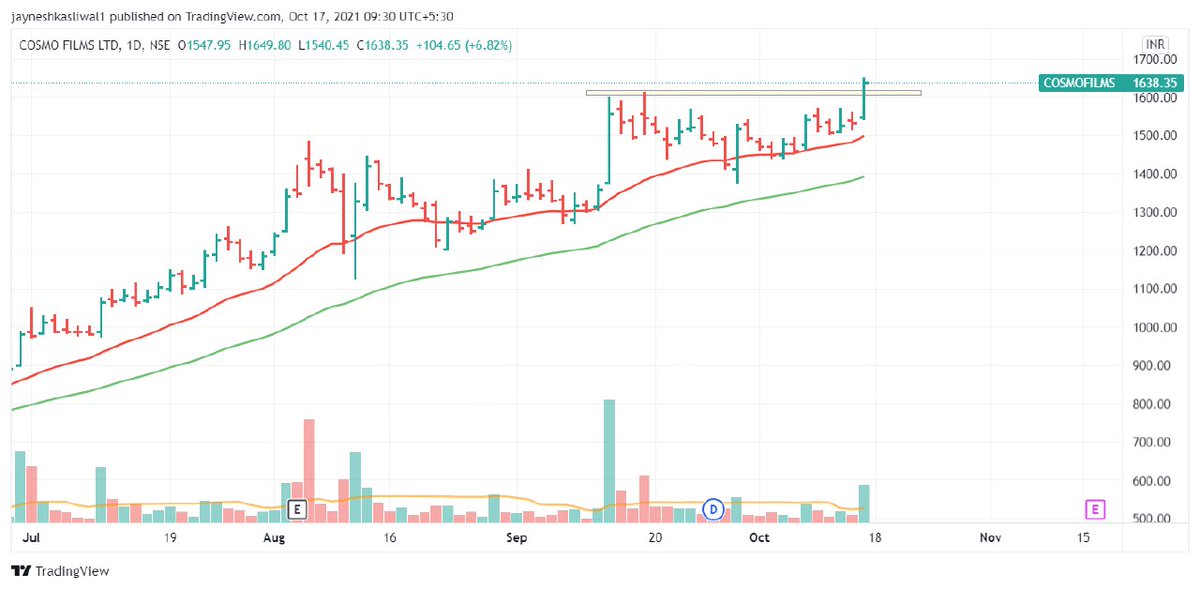
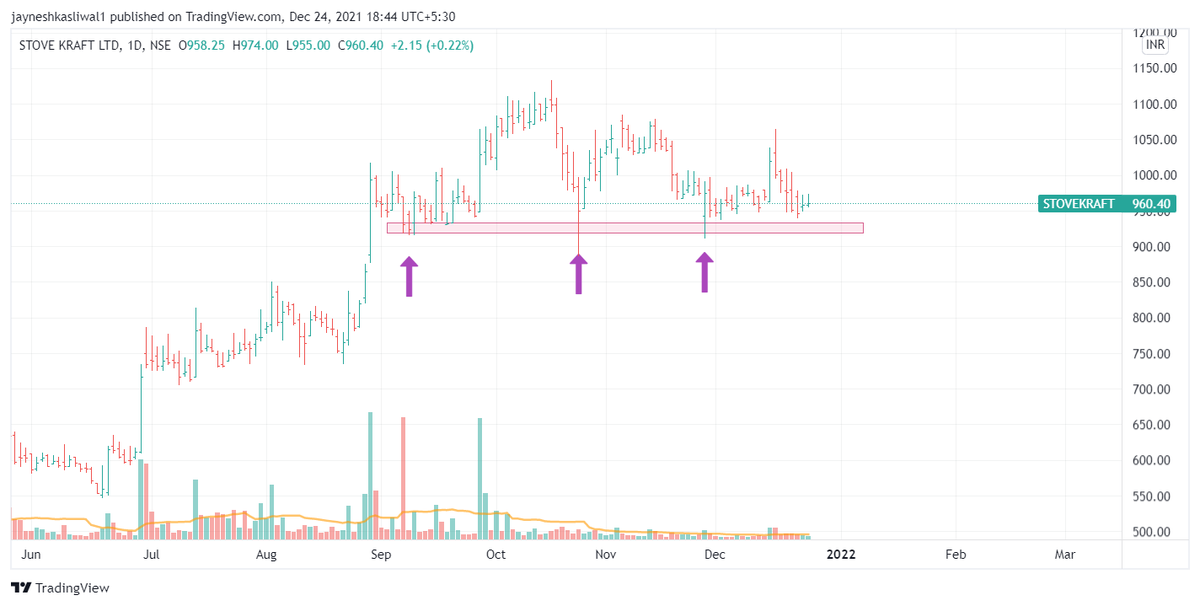
Example : #GREENPANEL
After 52 week High , mark the Top: Ceiling
After a small Reversal mark the Bottom : Floor
Enter As soon as the 52 week high breaks with stoploss
7/n
#RADICO #MANINFRA
✅Enter When 52 Week High is Broken , and Keep Adding as and when the box formation takes place .
🛑Keep Shifting the stoploss to next Box lows
8/n
PIC 1:
Entry on failed Breakout but Stops Dont hit as Stoploss is below the Box

PIC 2 : You should only draw boxes when the next 3 candles of 52 week high dont break the high.

9/n
Parameters checked : #MINDAIND
#kotakbank : Not valid Box , as stock is not breaking the 52 week high only the range breakout is happening

Also Restrict yourself to growth stocks that is midcaps and smallcaps
10/n
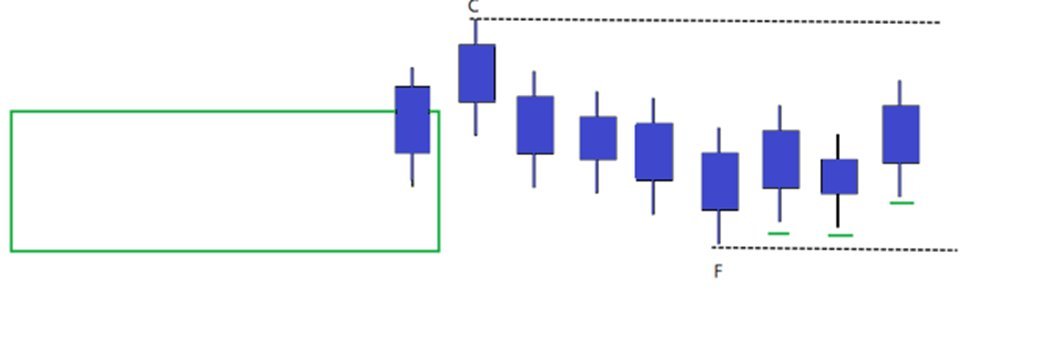
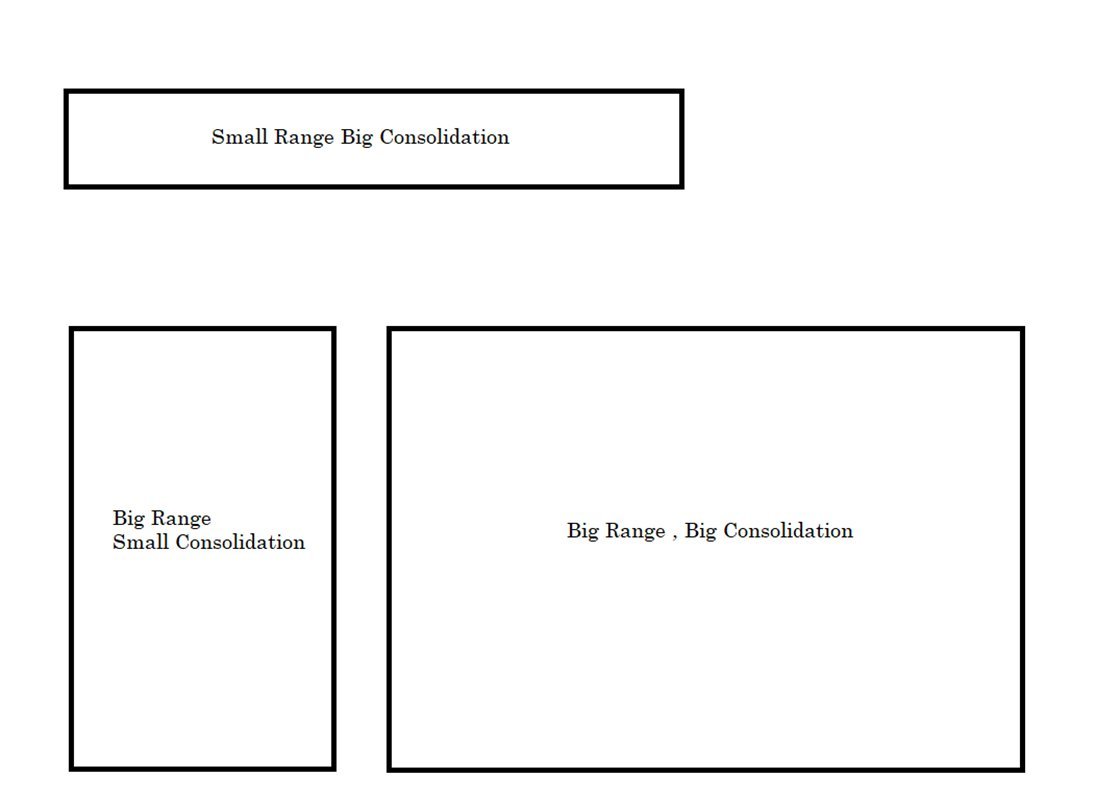
Time and % Differece of boxes :

There isnt any fixed % of difference from ceiling to floor mentioned any where
There also isnt any time frame mentioned how much the sideways trend or box formatiom will take place
There could be any combinations of boxes and there sizes
11/n
Short Ranges : IRCTC
Long Consolidation : BIRLASOFT
Short Range , Short Time : JINDWORLD
12/n
Trailing Stop and Pyramiding
1. Buy if price closes above Ceiling and put a stop-loss below Floor price.
2. Add Small Qtys as breakout happens and one can pyramid in winners and further breakouts
3. Ride the winner till you get Stopped
4. Reenter if stock regains 52 wk high
13/
3. After the breakout of the box, if price moves higher and forms another box, then trail stop-loss to the Floor price of the newly formed box and keep trailing on each subsequent floor.
4.Exit the trade when price goes below the floor price of the recent box.
@AmitabhJha3

14/n
STOCK FUNDAMENTALS
Buy companies whose growth & earnings prospects look highly promising
Overall Market trend should be bullish
Stocks should be outperforming the general Market and should be leader
Breakout should be always on higher volume
Prefer Midcaps and Smallcaps
15/n
Youtube Video about DARVAS BOX
https://t.co/9rQXhTispw
16/n
Follow @JayneshKasliwal and Join Telegram For charts and Analysis
https://t.co/z988Tz8lYu

END

More from JayneshKasliwal

The Ultimate Guide to moving averages !
A mega thread to understand the Use of 21 , 50 and 200 ema.
4 Effective uses of Exponential Moving Averages !

Retweet and Share 🔄
#stockmarkets #nifty
@kuttrapali26 @caniravkaria

Once Can refer the use of Moving Averages Throught this thread


4 Popular uses of moving averages

1. Identifying the direction of trend
2. MA crossover
3. Dynamic Support and Resistance
4. Price Crossing above Key EMAs

Note : In chart 21 ema is red , 50 ema is green and 200 ema is black

2/n


Why EMA and not SMA ?
EMA is fast , accurate and prices in recent data !
3/n


Use 1 : Identifying the trend of stock on dtf

The 21 ema will tell us the Short term trend of a stock , while the 200 ema will tell us the long term trend of a stocks

Any EMA that is sloping
:upwards trend is BULLISH
:sideways trend is NEUTRAL
:downwards trend is BEARISH
4/n
A thread of threads on 3 indicators

1. Moving Averages Ultimate Guide
2. All About ADX
3. Super Performance Using RELATIVE STRENGTH

Retweet and Share

Moving Average


All about


Super Performance Using RELATIVE STRENGTH
𝟱 𝗧𝗿𝗮𝗱𝗶𝗻𝗴𝘃𝗶𝗲𝘄 𝗜𝗻𝗱𝗶𝗰𝗮𝘁𝗼𝗿𝘀 𝗮𝗹𝗹 𝗧𝗿𝗮𝗱𝗲𝗿𝘀 𝘀𝗵𝗼𝘂𝗹𝗱 𝗸𝗻𝗼𝘄 𝗮𝗯𝗼𝘂𝘁:
𝗣𝗮𝗿𝘁 𝟮

🧵 Thread 🧵
Retweet And I will Link a 36 Page PDF

𝟭. 𝗔𝗱𝗱 𝗙𝘂𝗻𝗱𝗮𝗺𝗲𝗻𝘁𝗮𝗹𝘀 𝗼𝗻 𝗰𝗵𝗮𝗿𝘁
🔸 Link:
https://t.co/zG165Xa3JB
🔸 Click on the above link -> Add to Favourites -> Add on Chart from favourites and start using it !
2/20

You can add financials from many fundamental criteria's like
🔸 Cashflows
🔸 Income Statements
🔸 Balance sheets
🔸 PE,PB ratios
🔸 Marketcapitlization
🔸 Statistics
3/20


How to change Settings:
🔸 There are 8 columns you can basically select any financial you want
🔸 You can select quarterly or Yearly values and can also write
🔸 The names of the financiaLS Example : EPS Qtr3
🔸 You can Change colours , font size
4/20


𝟮. 𝗜𝗻𝗱𝗶𝗰𝗮𝘁𝗼𝗿 𝗥𝗮𝘁𝗶𝗻𝗴𝘀
You cannot track each and every indicator like ( 𝗠𝗼𝘃𝗶𝗻𝗴 𝗔𝘃𝗴𝘀 , 𝗥𝗦𝗜 , 𝗠𝗔𝗖𝗗 ) etc , you can use plot this custom strategy to understand whether the trend is positive or negative of those indicators
5/20

More from Screeners

One of the most successful stock trader with special focus on cash stocks and who has a very creative mind to look out for opportunities in dark times

Covering one of the most unique set ups: Extended moves & Reversal plays

Time for a 🧵 to learn the above from @iManasArora

What qualifies for an extended move?

30-40% move in just 5-6 days is one example of extended move

How Manas used this info to book


Post that the plight of the


Example 2: Booking profits when the stock is extended from 10WMA

10WMA =


Another hack to identify extended move in a stock:

Too many green days!

Read
TradingView isn't just charts

It's much more powerful than you think

9 things TradingView can do, you'll wish you knew yesterday: 🧵

Collaborated with @niki_poojary

1/ Free Multi Timeframe Analysis

Step 1. Download Vivaldi Browser

Step 2. Login to trading view

Step 3. Open bank nifty chart in 4 separate windows

Step 4. Click on the first tab and shift + click by mouse on the last tab.

Step 5. Select "Tile all 4 tabs"


What happens is you get 4 charts joint on one screen.

Refer to the attached picture.

The best part about this is this is absolutely free to do.

Also, do note:

I do not have the paid version of trading view.


2/ Free Multiple Watchlists

Go through this informative thread where @sarosijghosh teaches you how to create multiple free watchlists in the free


3/ Free Segregation into different headers/sectors

You can create multiple sections sector-wise for free.

1. Long tap on any index/stock and click on "Add section above."
2. Secgregate the stocks/indices based on where they belong.

Kinda like how I did in the picture below.

You May Also Like