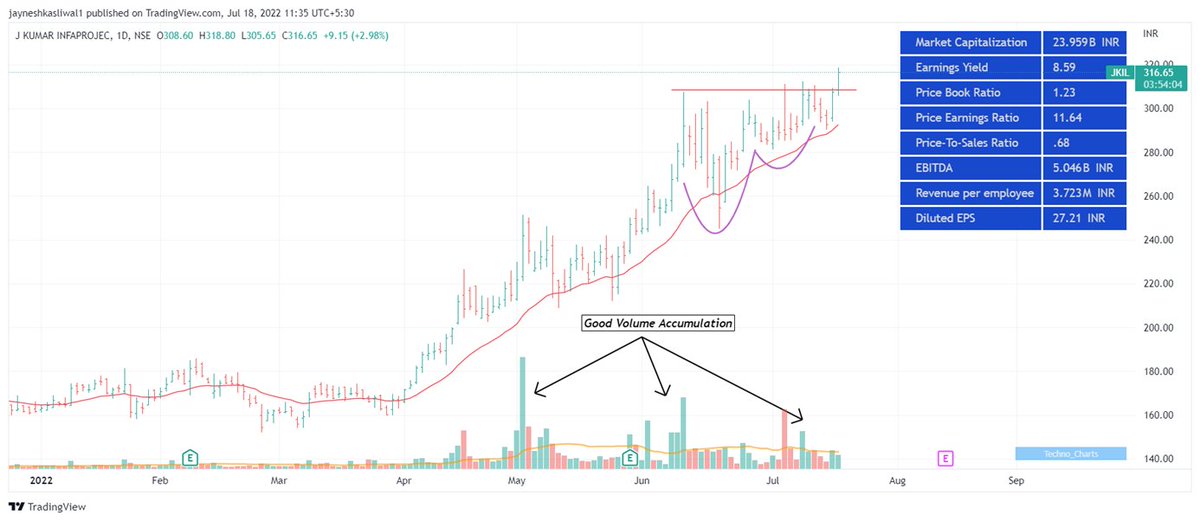
𝟭. 𝗔𝗱𝗱 𝗙𝘂𝗻𝗱𝗮𝗺𝗲𝗻𝘁𝗮𝗹𝘀 𝗼𝗻 𝗰𝗵𝗮𝗿𝘁
🔸 Link:
https://t.co/HcIXT7V002 🔸 Click on the above link -> Add to Favourites -> Add on Chart from favourites and start using it !
2/20
You can add financials from many fundamental criteria's like
🔸 Cashflows
🔸 Income Statements
🔸 Balance sheets
🔸 PE,PB ratios
🔸 Marketcapitlization
🔸 Statistics
3/20
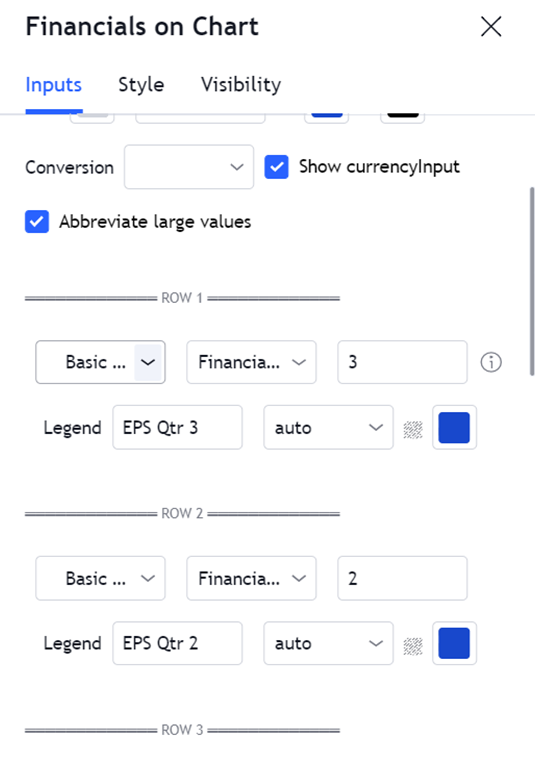
How to change Settings:
🔸 There are 8 columns you can basically select any financial you want
🔸 You can select quarterly or Yearly values and can also write
🔸 The names of the financiaLS Example : EPS Qtr3
🔸 You can Change colours , font size
4/20
𝟮. 𝗜𝗻𝗱𝗶𝗰𝗮𝘁𝗼𝗿 𝗥𝗮𝘁𝗶𝗻𝗴𝘀
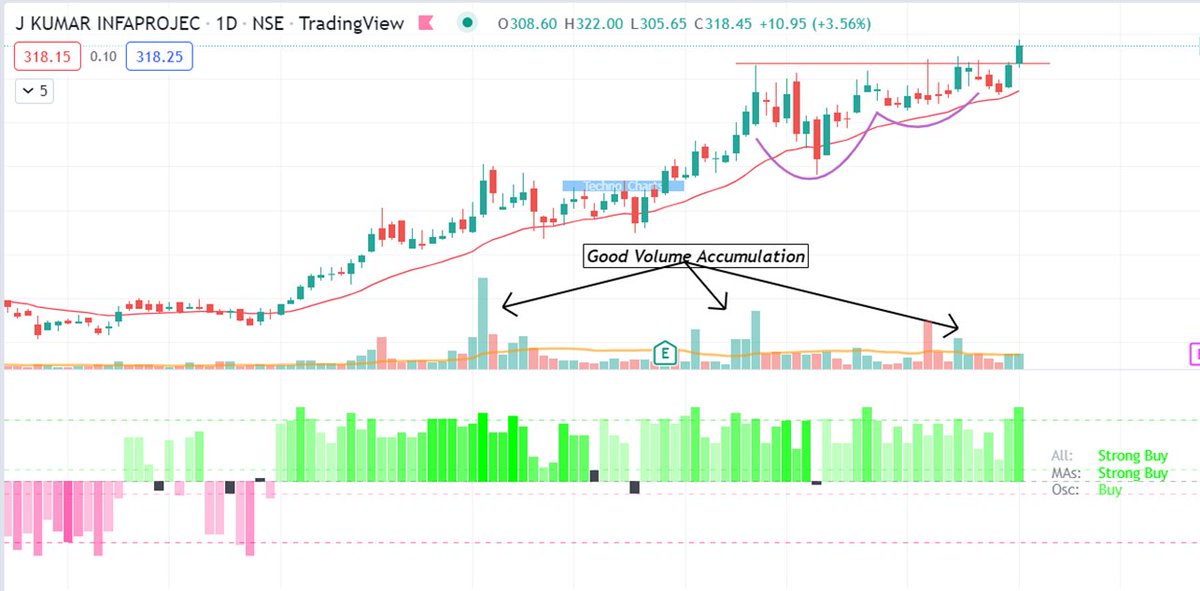
You cannot track each and every indicator like ( 𝗠𝗼𝘃𝗶𝗻𝗴 𝗔𝘃𝗴𝘀 , 𝗥𝗦𝗜 , 𝗠𝗔𝗖𝗗 ) etc , you can use plot this custom strategy to understand whether the trend is positive or negative of those indicators
5/20
🔸 Link
https://t.co/CIbb8TBllR 🔸 Click on the above link -> Add to Favourites -> Add on Chart from favourites and start using it !
6/20
𝗠𝘂𝗹𝘁𝗶-𝗧𝗶𝗺𝗲 𝗙𝗿𝗮𝗺𝗲 𝗜𝗻𝗱𝗶𝗰𝗮𝘁𝗼𝗿 𝗔𝗻𝗮𝗹𝘆𝘀𝗶𝘀
🔸 You can change the weightage of the indicators like 50-50 for MAs and Oscillator or 70-30
🔸 You can select different TF from chart to do MTF analysis
🔸 Change the colour of bullish and bearish signals
7/20
𝟯. 𝗖𝗔𝗚𝗥 𝗖𝘂𝘀𝘁𝗼𝗺 𝗥𝗮𝗻𝗴𝗲
🔸 You want to calculate the returns of stock say over 10 Years how much CAGR returns it has given , this is the indicator
🔸
https://t.co/C1PfTWJ28V 🔸 Just select 2 time periods and it will automatically calculate the CAGR .
8/20
🔸 You can even compare 2 returns over the same period Example : 𝘞𝘪𝘱𝘳𝘰 𝘷𝘴 𝘕𝘪𝘧𝘵𝘺
🔸 Select 2 points you want to calculate CAGR and if you wish to compare it with any asset then can use
🔸 Compare to “ and select the symbol like nifty , Gold or Nasdaq
9/20
𝟰. 𝗔𝗱𝗱 𝗪𝗮𝘁𝗲𝗿𝗺𝗮𝗿𝗸𝘀 !
🔸 Tired of people copying or stealing your charts
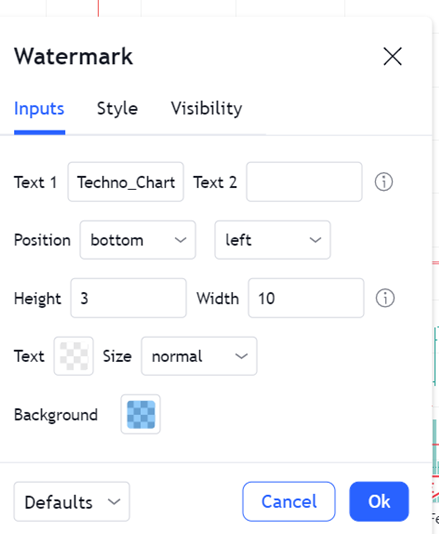
🔸 Use this watermark indicator where you can add your names or brand name anywhere in your chart
10/20
Link:
🔸
https://t.co/yLJdXjwU2B 🔸 Click on the above link -> Add to Favourites -> Add on Chart from favourites and start using it !
🔸 Increase Decrease the size of texts , change colours , change the positions
11/20
𝗠𝗲𝗻𝘁𝗼𝗿𝘀𝗵𝗶𝗽 𝗣𝗿𝗼𝗴𝗿𝗮𝗺
🔸 𝘚𝘵𝘢𝘳𝘵𝘪𝘯𝘨 𝘰𝘯 7𝘵𝘩 𝘈𝘶𝘨𝘶𝘴𝘵
🔸 Covering Price Action, Stage Analysis , Relative Strength
🔸 Whatsapp Link for Enquiry :
https://t.co/Y6WIyuTBrZ 🔸 Payment Link:
https://t.co/5xithBVOKJ 13/20
What Mentees have to say
Payment Link:
https://t.co/5xithBVOKJ ( You will be added Automatically on WhatsApp)
14/20
𝟱. 𝗗𝗶𝘃𝗲𝗿𝗴𝗲𝗻𝗰𝗲 𝗜𝗻𝗱𝗶𝗰𝗮𝘁𝗼𝗿
What Is RSI Divergence?
🔸 With RSI divergence, 𝘁𝗵𝗲 𝗥𝗦𝗜 𝗼𝗳 𝗮 𝘀𝗽𝗲𝗰𝗶𝗳𝗶𝗰 𝘀𝘁𝗼𝗰𝗸 𝘀𝗵𝗼𝘄𝘀 𝗹𝗼𝘄𝗲𝗿 𝗵𝗶𝗴𝗵𝘀 𝘄𝗵𝗲𝗻 𝘁𝗵𝗲 𝗽𝗿𝗶𝗰𝗲 𝘂𝗽𝘁𝗿𝗲𝗻𝗱 𝗵𝗶𝘁𝘀 𝗵𝗶𝗴𝗵𝗲𝗿 𝗵𝗶𝗴𝗵𝘀
15/20
🔸 Conversely, when the price is trending downward, it will hit lower lows with divergence while the RSI hits higher lows.
🔸 Link :https://t.co/ruxarAkiqg
🔸 Click on the above link -> Add to Favourites -> Add on Chart from favourites and start using it !
16/20
You can choose which type of divergence you want to check
⭐ You can select RSI period and time frame
⭐ After Bullish Divergence Stock prices
⭐ Divergence can fail also and it doesn’t
guarantee reversals
17/20
Detailed Youtube Video :https://t.co/hhRFxvCudX
18/20
Failed Divergence 𝗩𝘀 Successful divergence 𝗩𝘀 Nifty Divergences 19/20
If you like this thread please retweet the first tweet and follow me for more!
https://t.co/ocOvcWNrhj
For Divergence use this indicator
https://t.co/9bleSwMfOd /End/