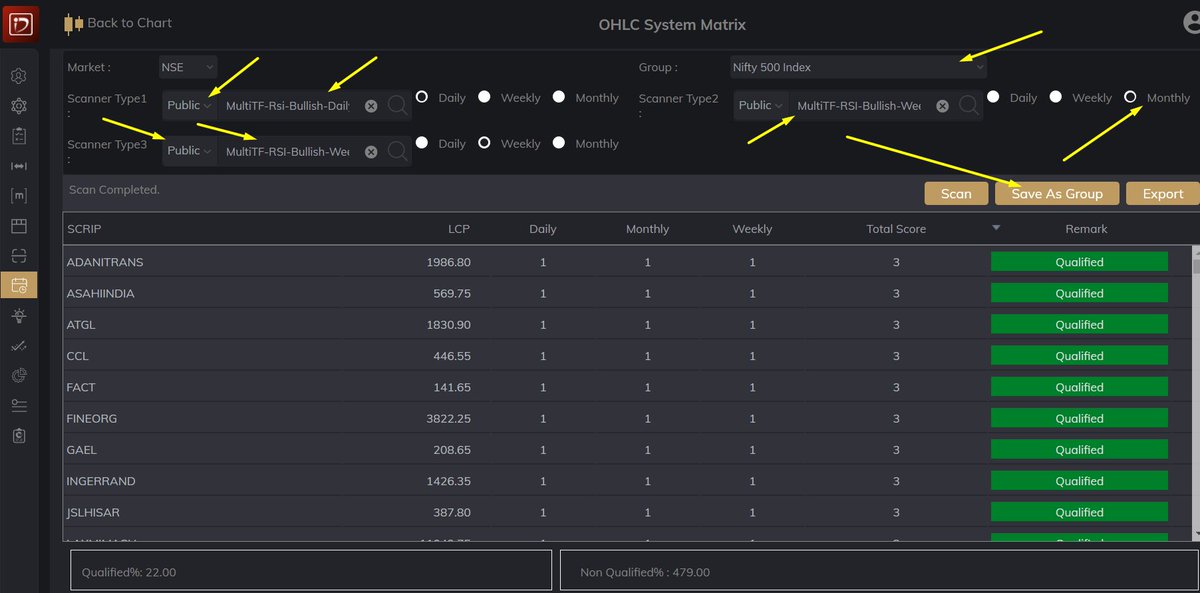
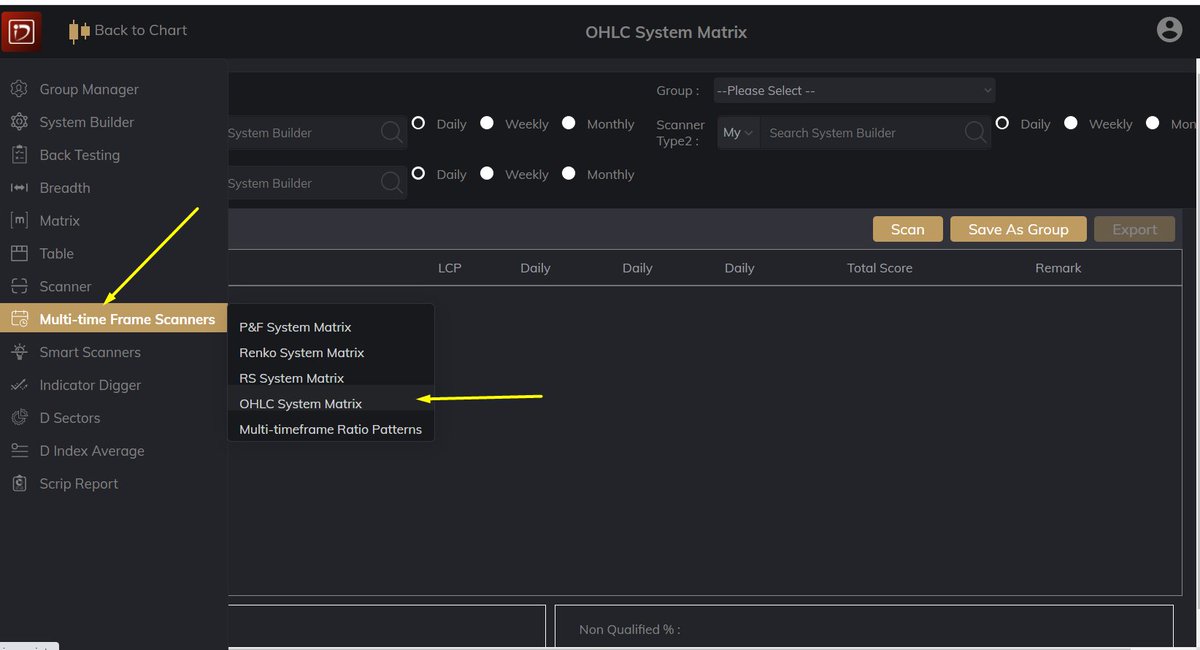
1) Run these scanners on Multi Time Frame Scanners
+

#CPR is an indicator which is used for #Intraday in Stock Market.
— Yash Mehta (@YMehta_) November 19, 2021
This learning thread would be on
"\U0001d650\U0001d668\U0001d65a\U0001d668 \U0001d664\U0001d65b \U0001d63e\U0001d64b\U0001d64d"
Like\u2764\ufe0f& Retweet\U0001f501for wider reach and for more such learning thread in the future.
Also, an investment strategy is shared using CPR in the end.
1/24
CPR indicator trend analysis:
— Gomathi Shankar (@cprbykgs) January 25, 2022
Candles below daily & weekly CPR \U0001f43b
Candles above daily CPR but below weekly CPR early confirmation of \U0001f402
Candles above daily + weekly CPR strong confirmation of \U0001f402
Isn\u2019t it simple?#cprbykgs #cprindicator #nifty #banknifty
#banknifty
— Gomathi Shankar (@cprbykgs) July 9, 2021
Candles above monthly CPR- Bullish
Candles above weekly CPR- Bullish
Now, whenever candles enter daily CPR range it indicates weakness of current trend & early signs of trend reversal.
So, wait for the candles to exit the daily CPR range then take the trade. (1/4) pic.twitter.com/7vaaLMCrV8
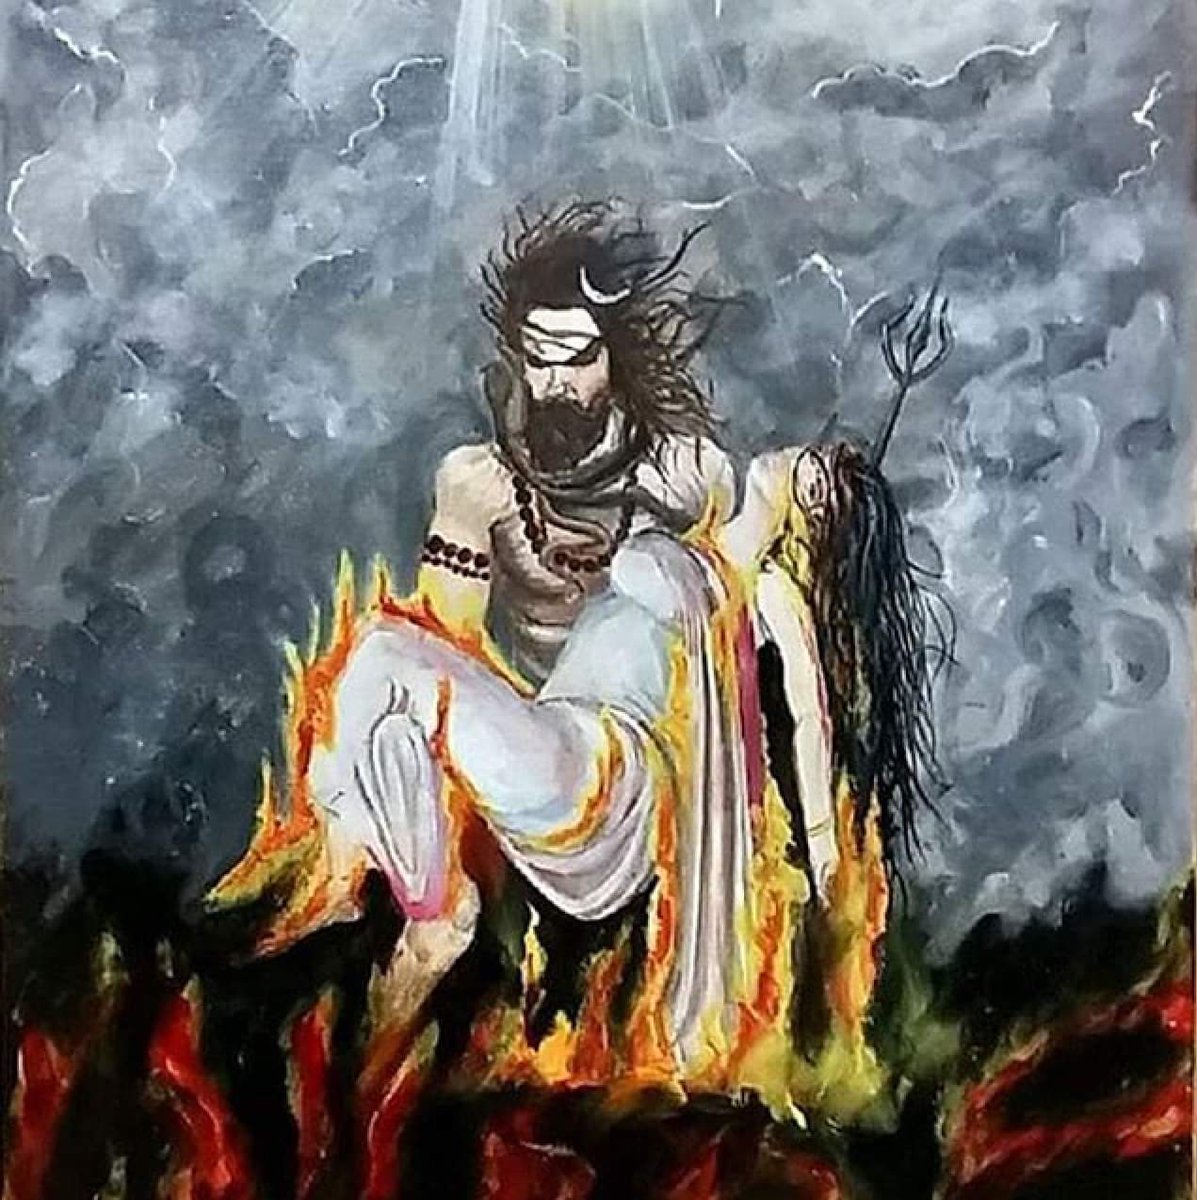
HOW LIFE EVOLVED IN THIS UNIVERSE AS PER OUR SCRIPTURES.
— Anshul Pandey (@Anshulspiritual) August 29, 2020
Well maximum of Living being are the Vansaj of Rishi Kashyap. I have tried to give stories from different-different Puran. So lets start.... pic.twitter.com/MrrTS4xORk
Thread on NARK(HELL) / \u0928\u0930\u094d\u0915
— Anshul Pandey (@Anshulspiritual) August 11, 2020
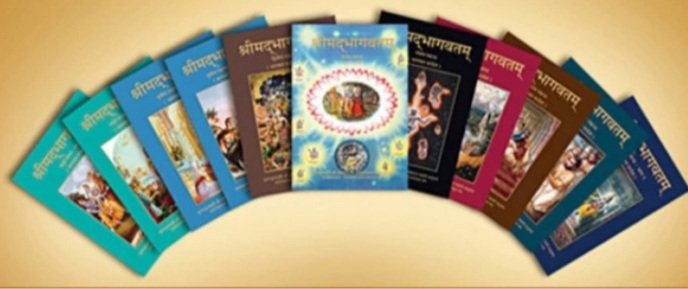
Well today i will take you to a journey where nobody wants to go i.e Nark. Hence beware of doing Adharma/Evil things. There are various mentions in Puranas about Nark, But my Thread is only as per Bhagwat puran(SS attached in below Thread)
1/8 pic.twitter.com/raHYWtB53Q
#THREAD
— Anshul Pandey (@Anshulspiritual) August 12, 2020
WHY PARENTS CHOOSE RELIGIOUS OR PARAMATMA'S NAMES FOR THEIR CHILDREN AND WHICH ARE THE EASIEST WAY TO WASH AWAY YOUR SINS.
Yesterday I had described the types of Naraka's and the Sin or Adharma for a person to be there.
1/8 pic.twitter.com/XjPB2hfnUC