Boss is always Boss @Mitesh_Engr
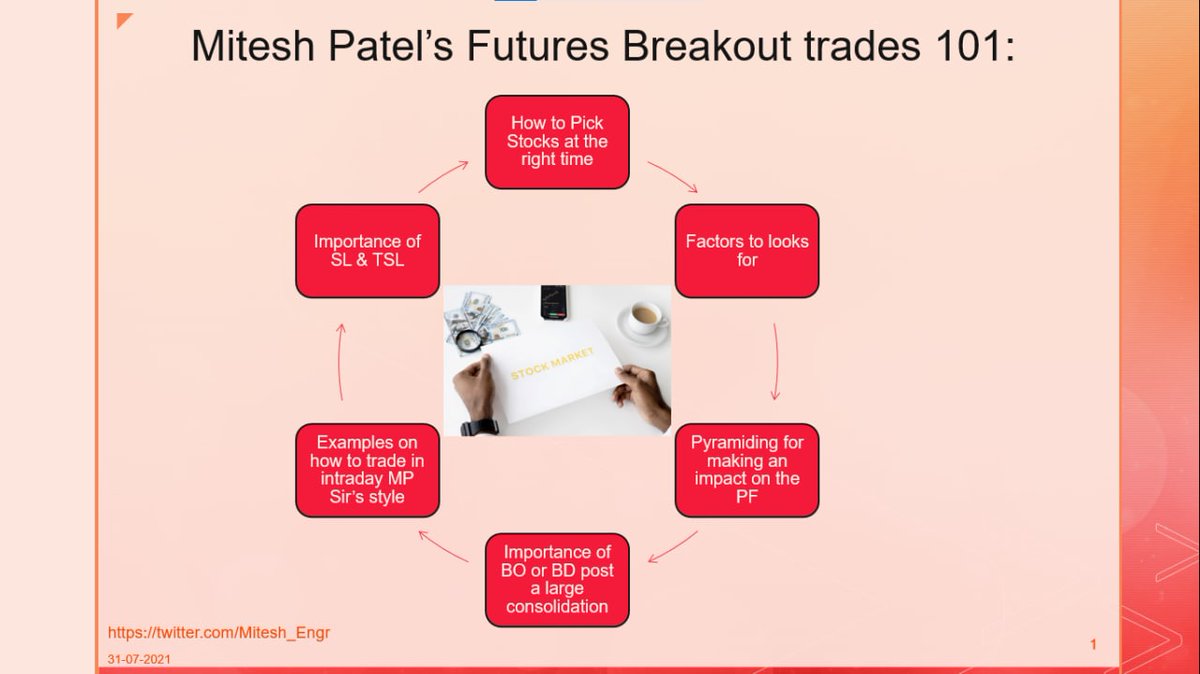
Mitesh Sir's FUTURES BREAKOUT TRADES 101:
• How to pick stocks at right time?
• What to look for?
• Importance of BO post consolidation
• How to manage SL
• How to get huge profits
• Multiple Examples
In collaboration with @niki_poojary
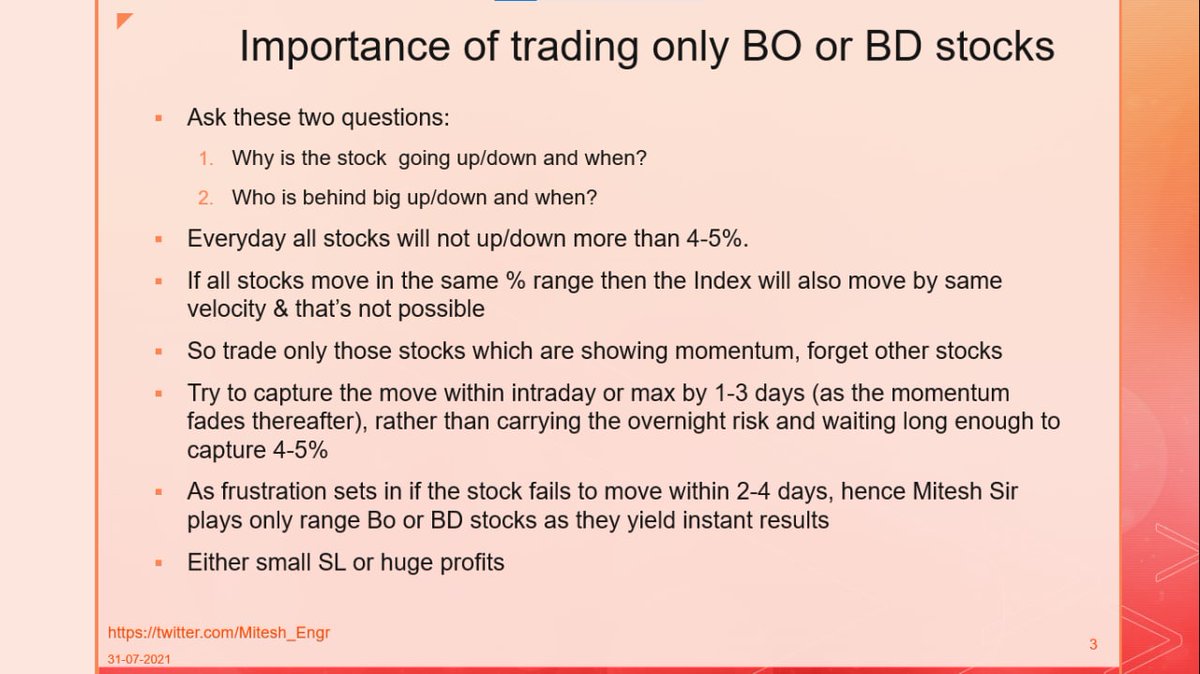
Importance of Trading only BO or BD stocks by @Mitesh_Engr Sir: 👇
•Two questions to always ask:
~Why stock is going up/down and when?
~ Who is behind big up/down and when?
• Trade only stocks with Momentum
• Instant results
• Small SL or huge profits
Sir's take on how to Trade: 👇
• Observe fight between buyer & seller
• Position will be created within first 3 hours
• Operators will win
• Just find BO or BD
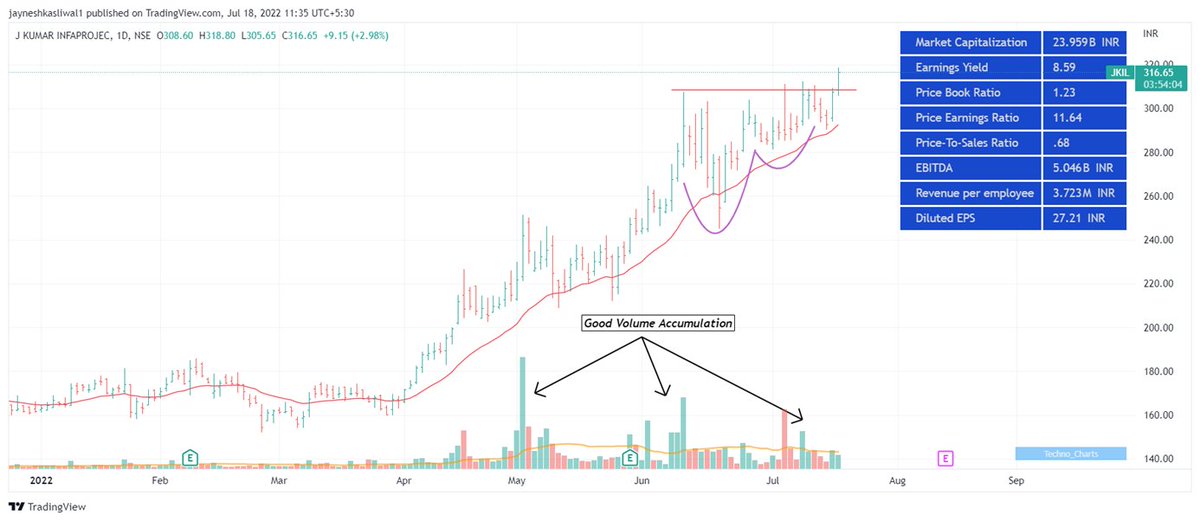
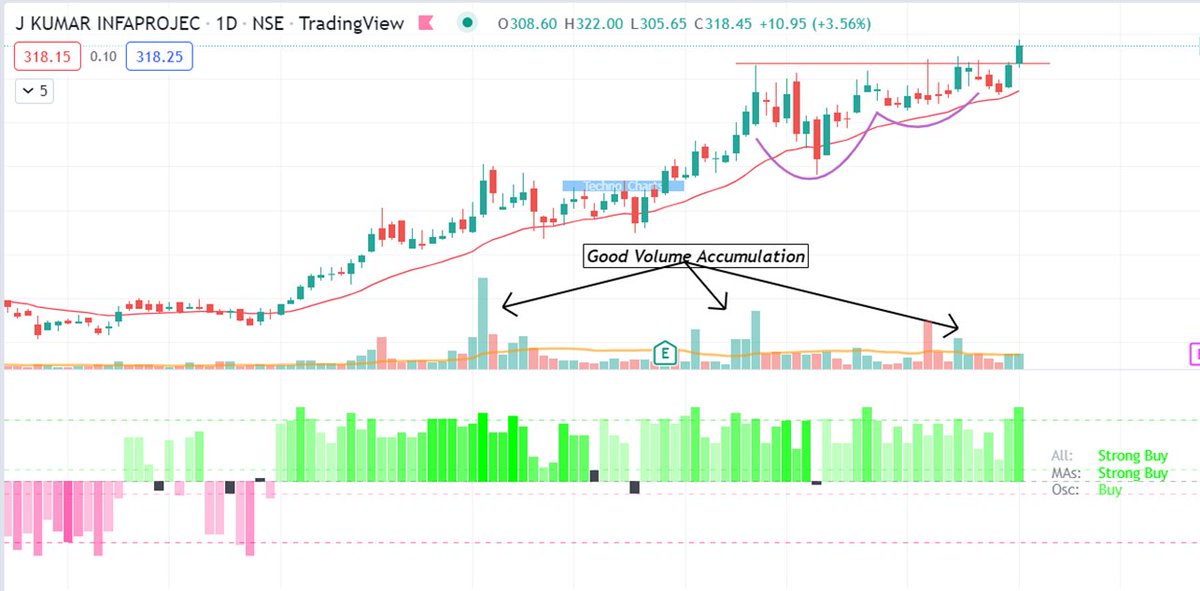
• Look for huge volume support
• Give company to operators
• ATP importance explained
How to take trade in Breakout/Breakdown stocks by @Mitesh_Engr Sir: 👇
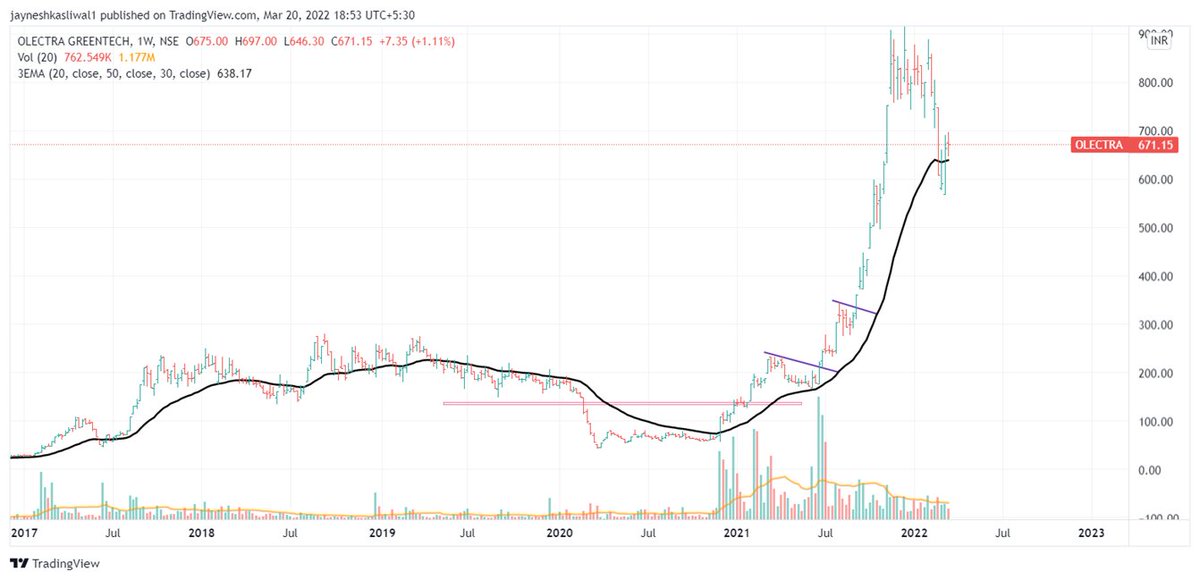
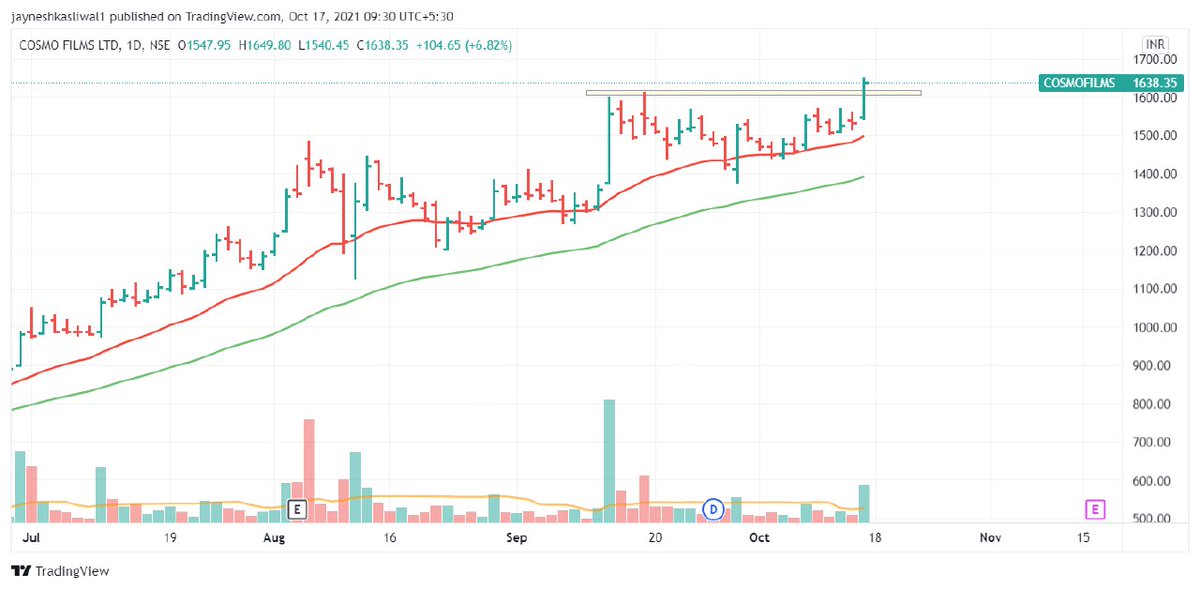
• Check Support & Resistance
• Wait for 2-3 months consolidation
• Surge in volumes
• Trade on 3 min charts
• Small SL
• Keep trailing
• Always pyramid in profit
When and Why to Pyramid? By @Mitesh_Engr Sir
• Adding to winning positions
• Signals of continued strength
• Potentially large profits
• An Example of pyramiding in one of his trades