Parameters
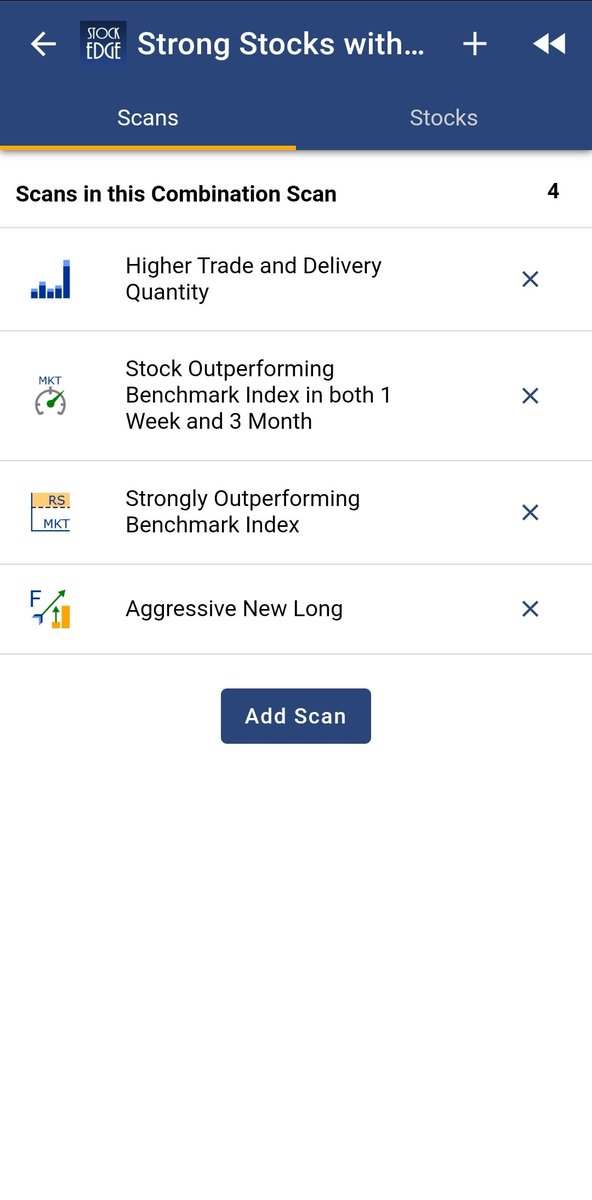
1.Price structure - higher swing highs & swing lows
2. Momentum - doubled in last 250 days & trade close to recent highs
3. Demand - Higher volume on green bars
4. Volatility - Bigger bars on upside & shorter on downside
5. Relative strength - Outperforming market
Hello Aneesh, (1) apart from the volume supported HH-HL formation in ATH or 52 weeks high stocks, what other data point u see to shortlist scrip? (2) How do u estimate the holding period for the scrip? Plz guide
— Rohit Khanna\U0001f1ee\U0001f1f3 (@Rohit_MktWale) March 26, 2022
More from Aneesh Philomina Antony (ProdigalTrader)
More from Screeners





You May Also Like

First thread of the year because I have time during MCO. As requested, a thread on the gods and spirits of Malay folk religion. Some are indigenous, some are of Indian origin, some have Islamic
Before I begin, it might be worth explaining the Malay conception of the spirit world. At its deepest level, Malay religious belief is animist. All living beings and even certain objects are said to have a soul. Natural phenomena are either controlled by or personified as spirits
Although these beings had to be respected, not all of them were powerful enough to be considered gods. Offerings would be made to the spirits that had greater influence on human life. Spells and incantations would invoke their
Two known examples of such elemental spirits that had god-like status are Raja Angin (king of the wind) and Mambang Tali Arus (spirit of river currents). There were undoubtedly many more which have been lost to time
Contact with ancient India brought the influence of Hinduism and Buddhism to SEA. What we now call Hinduism similarly developed in India out of native animism and the more formal Vedic tradition. This can be seen in the multitude of sacred animals and location-specific Hindu gods
i wonder if you can make a thread bout witchcraft in malaysia.. or list of our own local gods/deites..
— r a y a \U0001f319 (@lcvelylilith) February 20, 2020
Before I begin, it might be worth explaining the Malay conception of the spirit world. At its deepest level, Malay religious belief is animist. All living beings and even certain objects are said to have a soul. Natural phenomena are either controlled by or personified as spirits
Although these beings had to be respected, not all of them were powerful enough to be considered gods. Offerings would be made to the spirits that had greater influence on human life. Spells and incantations would invoke their
Animist ceremonies of a religious or magical nature were normally held for the purpose of divination or making a request. This would either be done at a keramat or at a shrine similar to the Thai spirit houses or Chinese roadside shrines pic.twitter.com/I1hliyi0x3
— \u2745\u1710\u170b\u1713\u170e (@uglyluhan) June 16, 2019
Two known examples of such elemental spirits that had god-like status are Raja Angin (king of the wind) and Mambang Tali Arus (spirit of river currents). There were undoubtedly many more which have been lost to time
Contact with ancient India brought the influence of Hinduism and Buddhism to SEA. What we now call Hinduism similarly developed in India out of native animism and the more formal Vedic tradition. This can be seen in the multitude of sacred animals and location-specific Hindu gods





Speech Delay is most common in children nowadays
In ancient times, our grandparents used to follow typical natural way of caring the needs of a child. All they used were more of natural products than chemical based for the growth of child.
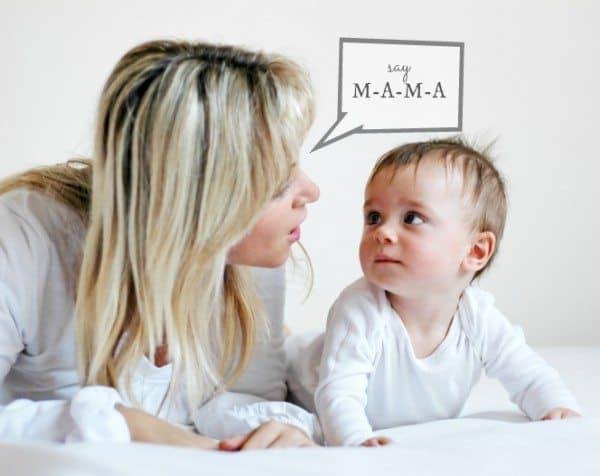
One of major step followed was to feed Gurbach Jadd/ Vasa Kommu/ Acorus Calamus for initiating good speech ability in a child. This stem was needed to babies on Tuesdays and Sundays in mother's milk.
Vasa is feed to baby after the 1st bath on 12th day in week. Weekly only thrice it is fed and named as :
Budhwar - Budhi Vasa
Mangalwar - Vaak Vasa
Ravi Vaar - Aayush Vasa
This stem is burnt and rubbed against the grinding stone in mother's milk or warm water to get a paste
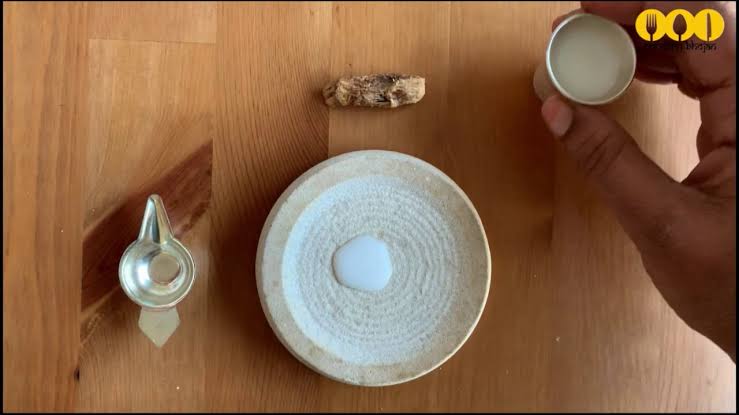
The procedure to make it is in the link
https://t.co/uo4sGp7mUm
It should not be given daily to the child. Other main benefits are
1. It clears the phlegm in child's throat caused due to continuous milk intake. It clears the tracts and breathing is effortless.
2. Digestion
For children who haven't got their speech and is delayed than usual should feed this vasa on these days in week atleast for 6months. Don't get carried away with this dialogue
"Some gain speech little late"
In ancient times, our grandparents used to follow typical natural way of caring the needs of a child. All they used were more of natural products than chemical based for the growth of child.
One of major step followed was to feed Gurbach Jadd/ Vasa Kommu/ Acorus Calamus for initiating good speech ability in a child. This stem was needed to babies on Tuesdays and Sundays in mother's milk.
Vasa is feed to baby after the 1st bath on 12th day in week. Weekly only thrice it is fed and named as :
Budhwar - Budhi Vasa
Mangalwar - Vaak Vasa
Ravi Vaar - Aayush Vasa
This stem is burnt and rubbed against the grinding stone in mother's milk or warm water to get a paste
The procedure to make it is in the link
https://t.co/uo4sGp7mUm
It should not be given daily to the child. Other main benefits are
1. It clears the phlegm in child's throat caused due to continuous milk intake. It clears the tracts and breathing is effortless.
2. Digestion
For children who haven't got their speech and is delayed than usual should feed this vasa on these days in week atleast for 6months. Don't get carried away with this dialogue
"Some gain speech little late"