3. The 200-day moving average line is trending up for at least 1-month (preferably 4 to 5 months or longer).
4. The 50-day (10-week moving average) is above both the 150-day and the 200-day moving averages.
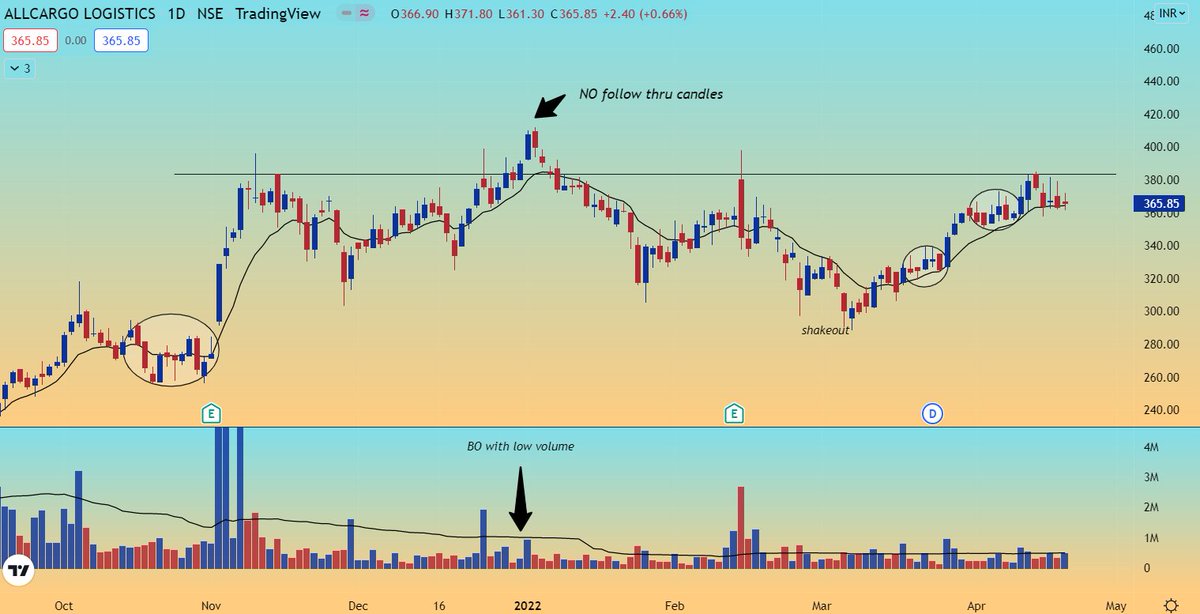
#AllCargo
— VCP Charts\U0001f4c8 (@vcpcharts) April 17, 2022
\U0001f3afGood accumulation from base bottom
\U0001f3af Pocket pivots and shakeout will give strength for breakout
\U0001f3af RS strength-81
\U0001f3af EPS strength-90
\U0001f3af Expecting more tightness near pivot point for entry@Accuracy_Invst @swing_ka_sultan @StocksNerd @VVVStockAnalyst @charts_zone pic.twitter.com/yb6pX4Kro5
The stock exploded & went up as much as 63% from my price.
— Manas Arora (@iManasArora) June 22, 2020
Closed my position entirely today!#BroTip pic.twitter.com/CRbQh3kvMM
What an extended (away from averages) move looks like!!
— Manas Arora (@iManasArora) June 24, 2020
If you don't learn to sell into strength, be ready to give away the majority of your gains.#GLENMARK pic.twitter.com/5DsRTUaGO2
#HIKAL
— Manas Arora (@iManasArora) July 2, 2021
Closed remaining at 560
Reason: It is 40+% from 10wma. Super extended
Total revenue: 11R * 0.25 (size) = 2.75% on portfolio
Trade closed pic.twitter.com/YDDvhz8swT
When you see 15 green weeks in a row, that's the end of the move. *Extended*
— Manas Arora (@iManasArora) August 26, 2019
Simple price action analysis.#Seamecltd https://t.co/gR9xzgeb9K