
How to select good Breakout Trades:
Breakouts in the direction of the general trend
The longer the market is in a range, the stronger the breakout
Stock making higher lows near resistance zone
(lower highs near support zone is a sign of weakness)
Some ofthe biggest breakouts occur after Volatility Contraction, the analogy is that more a spring is pressed, higher it jumps whenever it gets released.
— Professor (@DillikiBiili) October 2, 2021
There is a VCP Scanner on chartink (Not mine). This may also be used to find potential Breakouts. pic.twitter.com/y1lmay7D4e
More from Professor


Gold taking bounce from support ! https://t.co/sPIay6edQU
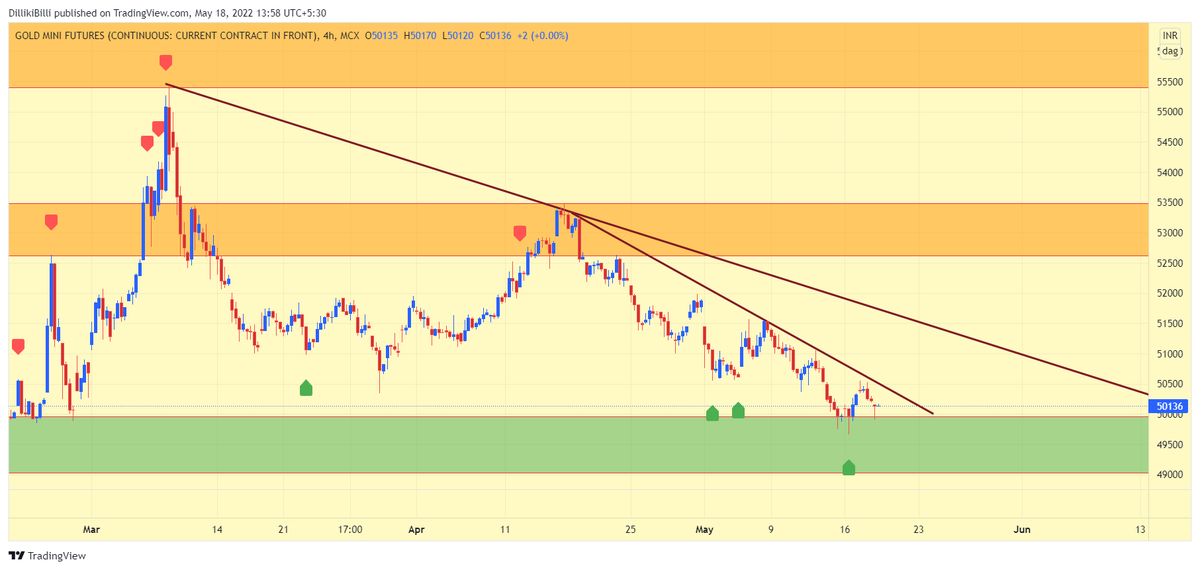
Gold is down for now, but every time demand is coming from the support zone.
— Professor (@DillikiBiili) May 8, 2022
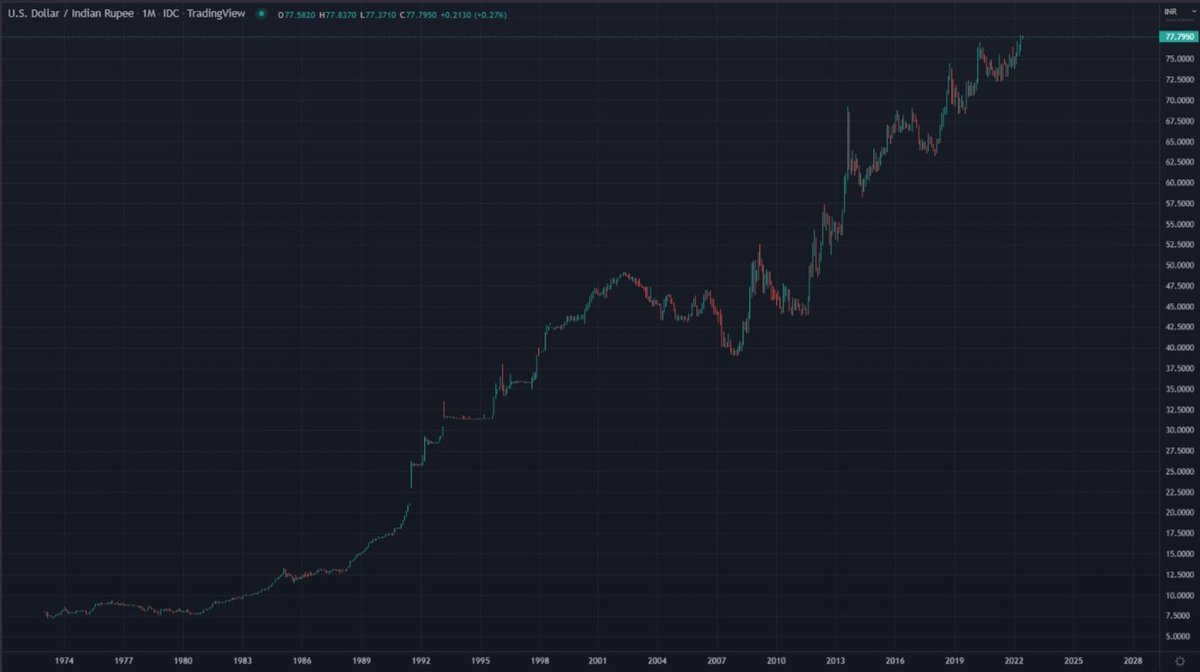
I am bullish on Gold for long terms, as per me it would break its ATH resistance, my expected target is BRN of USD 3K/Oz. https://t.co/XT1l48pEx5 pic.twitter.com/8ViSeIPDzN
Jab tak ki meri book nahi aati, ye kar lo:
1. Go through Zerodha Varsity chapters on Technical Analysis at least 2 times.
2. Then read 'Technical Analysis Explained' by Martin Pring
3. Finally read 'Price Action bar by bar' by Al Books (Not for casual reader).
1. Go through Zerodha Varsity chapters on Technical Analysis at least 2 times.
2. Then read 'Technical Analysis Explained' by Martin Pring
3. Finally read 'Price Action bar by bar' by Al Books (Not for casual reader).
Sir @DillikiBiili , could you please suggest a book for technical analysis ?
— Pawan Yadav (@pawan_yadav86) March 25, 2022
More from Screeners

Chartink Screeners Complete Compilation
Sharing 9 Screeners🧵
1. Swing Trading Techno Funda https://t.co/sV6e8XSFRK
2.Range Breakout
https://t.co/SNKEpGHNtv
3. Stocks in Tight Range :
https://t.co/MqDFMEfj82
Telegram Link : https://t.co/b4N4oPjqm9
Retweet and Share !
4.Stock Closing up 3% Since 3 days
https://t.co/vLGG9k3YKz
5. Close above 21 ema
https://t.co/fMZkgLczxR
6. Days Fall and Reversal
7. 52 WEEK high Stocks.
https://t.co/H6Z6IGMRwS
8. Intraday Stocks :https://t.co/JoXYRcogj7
9. Darvas Box


You May Also Like


1/OK, data mystery time.
This New York Times feature shows China with a Gini Index of less than 30, which would make it more equal than Canada, France, or the Netherlands. https://t.co/g3Sv6DZTDE
That's weird. Income inequality in China is legendary.
Let's check this number.
2/The New York Times cites the World Bank's recent report, "Fair Progress? Economic Mobility across Generations Around the World".
The report is available here:
3/The World Bank report has a graph in which it appears to show the same value for China's Gini - under 0.3.
The graph cites the World Development Indicators as its source for the income inequality data.

4/The World Development Indicators are available at the World Bank's website.
Here's the Gini index: https://t.co/MvylQzpX6A
It looks as if the latest estimate for China's Gini is 42.2.
That estimate is from 2012.
5/A Gini of 42.2 would put China in the same neighborhood as the U.S., whose Gini was estimated at 41 in 2013.
I can't find the <30 number anywhere. The only other estimate in the tables for China is from 2008, when it was estimated at 42.8.
This New York Times feature shows China with a Gini Index of less than 30, which would make it more equal than Canada, France, or the Netherlands. https://t.co/g3Sv6DZTDE
That's weird. Income inequality in China is legendary.
Let's check this number.
2/The New York Times cites the World Bank's recent report, "Fair Progress? Economic Mobility across Generations Around the World".
The report is available here:
3/The World Bank report has a graph in which it appears to show the same value for China's Gini - under 0.3.
The graph cites the World Development Indicators as its source for the income inequality data.
4/The World Development Indicators are available at the World Bank's website.
Here's the Gini index: https://t.co/MvylQzpX6A
It looks as if the latest estimate for China's Gini is 42.2.
That estimate is from 2012.
5/A Gini of 42.2 would put China in the same neighborhood as the U.S., whose Gini was estimated at 41 in 2013.
I can't find the <30 number anywhere. The only other estimate in the tables for China is from 2008, when it was estimated at 42.8.

