The report is available here: https://t.co/mrvWz1IzIe
1/OK, data mystery time.
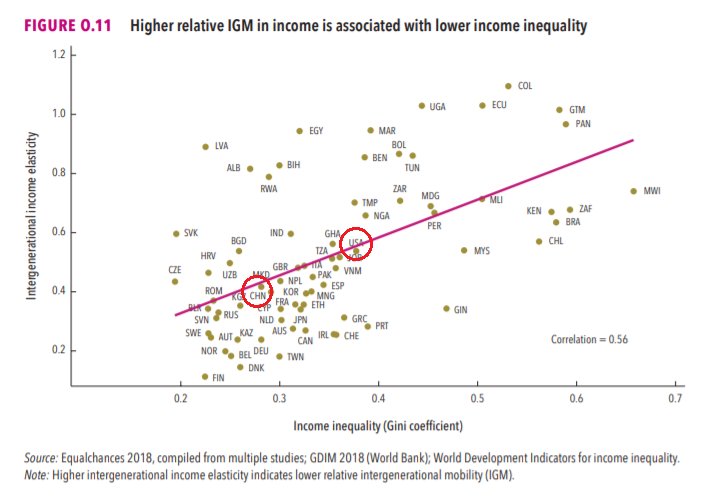
This New York Times feature shows China with a Gini Index of less than 30, which would make it more equal than Canada, France, or the Netherlands. https://t.co/g3Sv6DZTDE
That's weird. Income inequality in China is legendary.
Let's check this number.
The report is available here: https://t.co/mrvWz1IzIe
The graph cites the World Development Indicators as its source for the income inequality data.

Here's the Gini index: https://t.co/MvylQzpX6A
It looks as if the latest estimate for China's Gini is 42.2.
That estimate is from 2012.
I can't find the <30 number anywhere. The only other estimate in the tables for China is from 2008, when it was estimated at 42.8.
Everyone except the "Fair Progress?" report, and the New York Times feature, seems to agree that the World Bank's most recent estimate of China's Gini is 42.2.
But the GDIM doesn't have income GINIs. So that can't be where these weird numbers were from (unless the data was mislabeled).
https://t.co/vmzz57YeFf
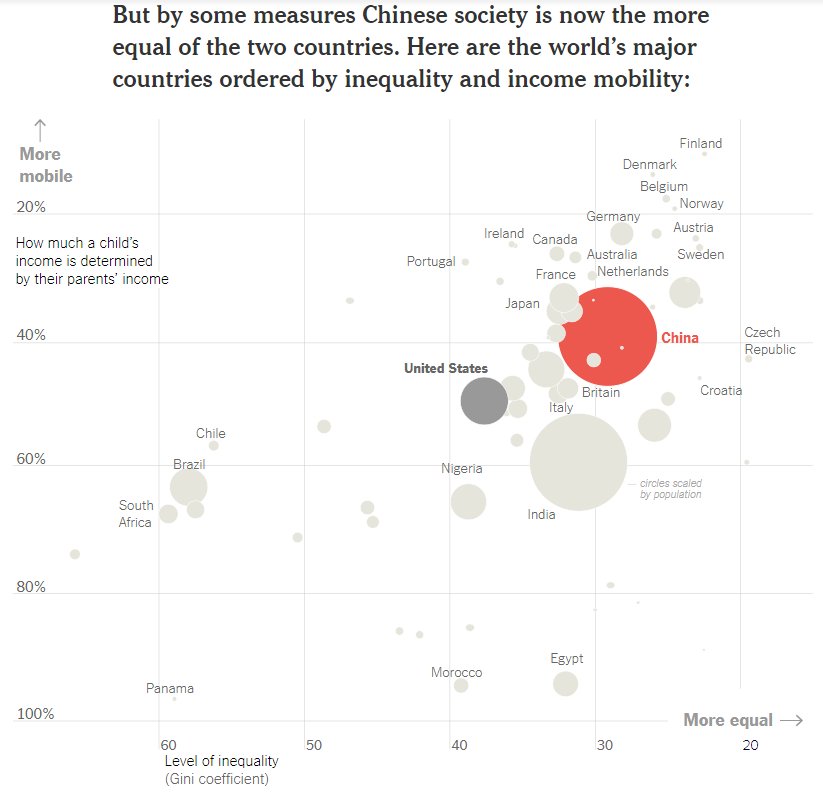
Wow. China has higher income mobility and lower inequality than the United States https://t.co/29BHdzbAll
— Tanay Jaipuria (@tanayj) November 19, 2018
(end...for now)
The Gini number the NYT used was from the 1980s. It was not labeled as such.
Hi Noah, Thanks for reaching out. The figure you refer to shows a Great Gatsby curve that plots income mobility against inequality for parents generation, i.e. inequality in 80s. Gini for China is around 0.3 at that time, and can be found in PovCalNet & @BrankoMilan All the Ginis
— Roy Van Der Weide (@rroyji) November 19, 2018
More from Noah Smith
Bloomberg Ideas conference now starting! I will be live-tweeting it. You can watch on our Facebook or Twitter pages (links below)!
Our first panel is about cryptocurrency! We have @matt_levine, @tylercowen, @eiaine, @nirkaissar, and Camilla
Ou: Crypto will be useful for the unbanked.
Cowen: Crypto has to compete against a bunch of other emerging payments technologies. Bitcoin is too inflexible.
Cowen: I'll bet on the payments companies over crypto.
Today and tomorrow we'll be having a Bloomberg Ideas event!
— Noah Smith (@Noahpinion) October 25, 2018
Today will be a panel on cryptocurrency.
Tomorrow will be panels on the economics of AI, and on regulation of big tech companies.
You can watch livestreams here:https://t.co/1dC0ELGvabhttps://t.co/Juz5Mp2EC1 pic.twitter.com/VfxOscNflo
Our first panel is about cryptocurrency! We have @matt_levine, @tylercowen, @eiaine, @nirkaissar, and Camilla
Ou: Crypto will be useful for the unbanked.
Cowen: Crypto has to compete against a bunch of other emerging payments technologies. Bitcoin is too inflexible.
Cowen: I'll bet on the payments companies over crypto.
This is so dumb and incorrect and wrong it's unbelievable.
Facts.
Facts!!
FACTS FACTS
Moar
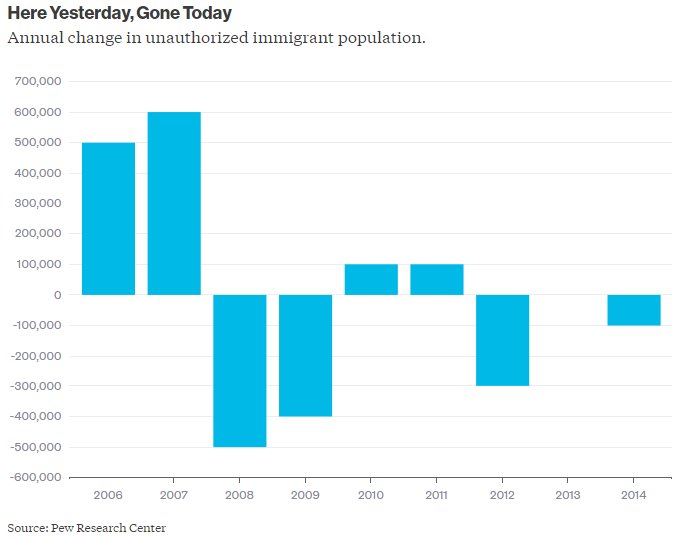
Secretary of State Mike Pompeo said the U.S. is quickly approaching \u201ca moment of crisis\u201d because of the \u201crecord number of migrants\u201d spilling into the country https://t.co/QuiWPcXswA
— POLITICO (@politico) October 20, 2018
Facts.
Facts!!
FACTS FACTS
Moar
1/OK, so. Let's talk about Left-NIMBYism.
We all know about Right-NIMBYs, rabidly protecting their white-flight suburbs from Those People. And there are plenty of liberal NIMBYs too.
But NIMBYs of the Left are also a force to be reckoned
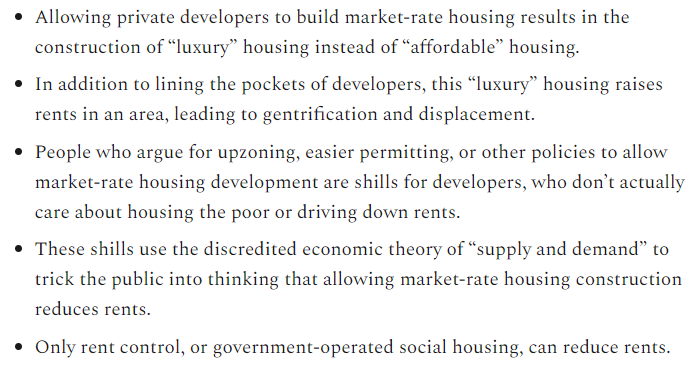
2/Left-NIMBYs have developed a canon of interlocking, mutually reinforcing beliefs about housing and urbanism.
These beliefs are mostly false, but they form a powerful "canon" that quickly ossifies into a hardened worldview.
It looks something like this:
3/Fortunately, Nathan J. Robinson of Current Affairs has written an article that perfectly encapsulates the Left-NIMBY worldview (and quotes me in it!).
So this is a teachable
4/Robinson selectively quotes a Bloomberg article of mine (https://t.co/iamRrW6oei).
Look at the part he quoted, vs. what I actually wrote!
Pretty different, eh? 😉
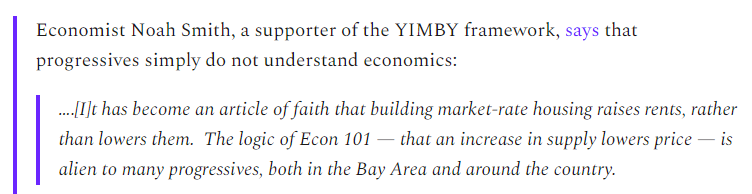
5/In fact, as I wrote in the article that Robinson failed to read more than one line of, it's theoretically possible that Left-NIMBYs COULD be right that allowing market-rate housing drives up local rents.
I take that possibility very seriously, as do YIMBYs.
We all know about Right-NIMBYs, rabidly protecting their white-flight suburbs from Those People. And there are plenty of liberal NIMBYs too.
But NIMBYs of the Left are also a force to be reckoned
2/Left-NIMBYs have developed a canon of interlocking, mutually reinforcing beliefs about housing and urbanism.
These beliefs are mostly false, but they form a powerful "canon" that quickly ossifies into a hardened worldview.
It looks something like this:
3/Fortunately, Nathan J. Robinson of Current Affairs has written an article that perfectly encapsulates the Left-NIMBY worldview (and quotes me in it!).
So this is a teachable
4/Robinson selectively quotes a Bloomberg article of mine (https://t.co/iamRrW6oei).
Look at the part he quoted, vs. what I actually wrote!
Pretty different, eh? 😉
5/In fact, as I wrote in the article that Robinson failed to read more than one line of, it's theoretically possible that Left-NIMBYs COULD be right that allowing market-rate housing drives up local rents.
I take that possibility very seriously, as do YIMBYs.