
Let us think about creating an indicator that shows the trend.
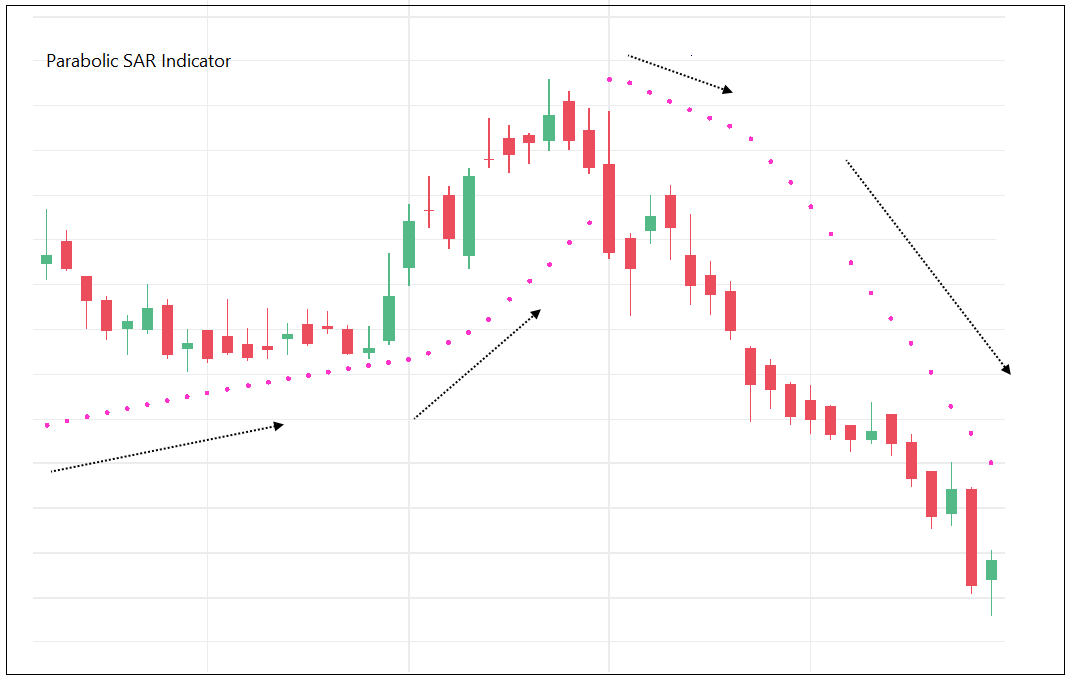
Thread: Parabolic SAR Indicator
Parabolic SAR (PSAR) indicator was developed by J. Welles Wilder.
#PSAR #Indicators #Definedge
Let us think about creating an indicator that shows the trend.
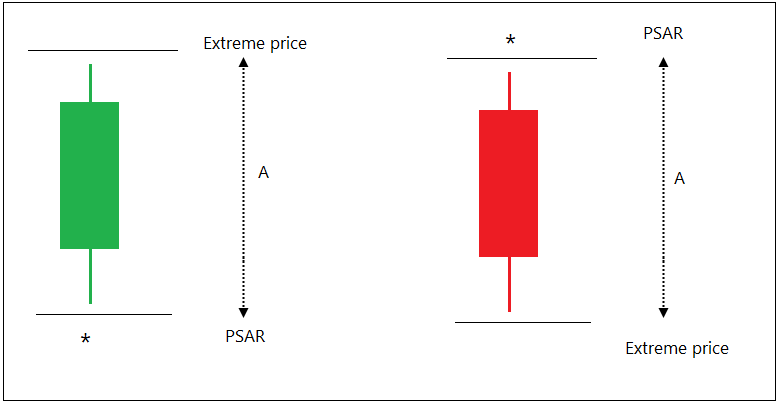
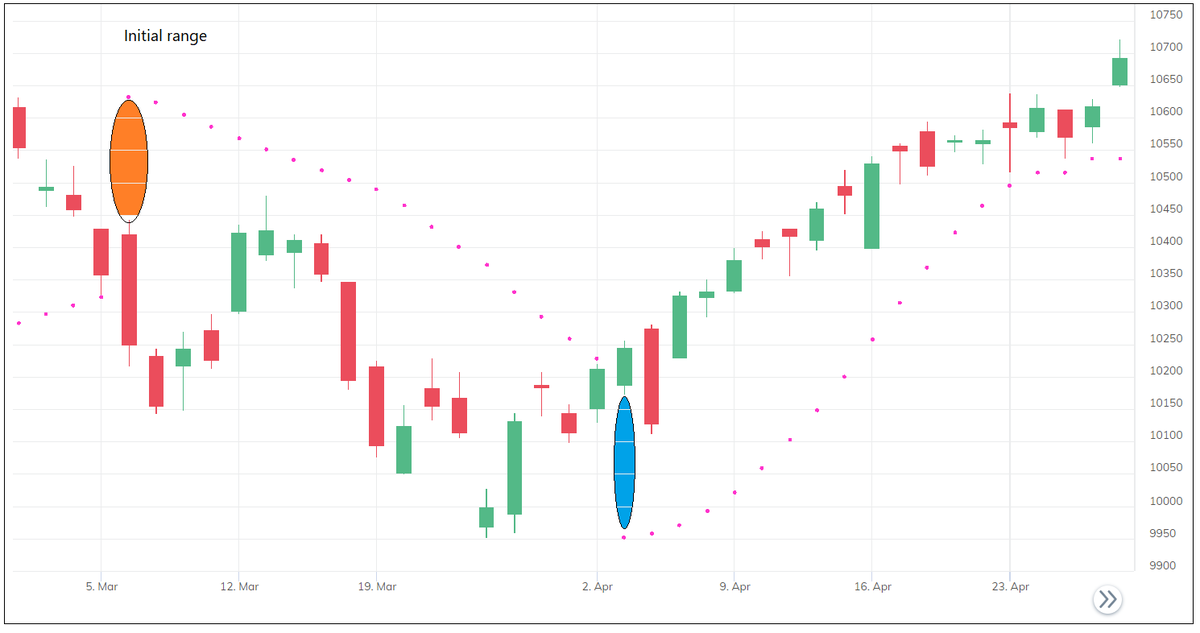
For trailing the stop in uptrend, indicator needs to be placed below the candle. Similarly, it should be placed above the candle for trailing in a downtrend. We will plot it using ‘dots’.
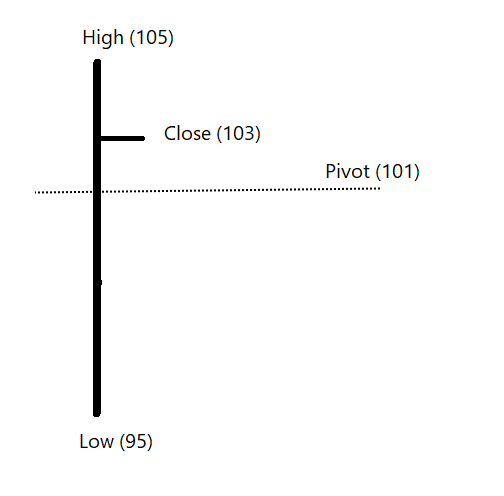
Let us define the trend as:
If Low of the candle > Stop-loss level in bull market = Trend remains bullish.
If High of the candle < Stop-loss level in bear market = Trend is bearish

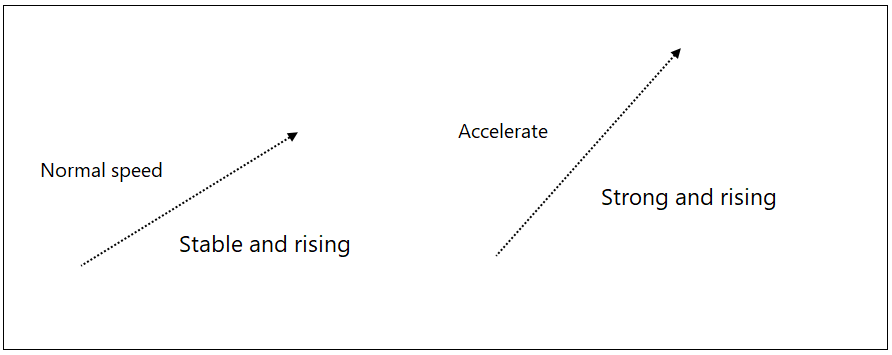
The indicator rises steadily if the trend is steady. If the trend is strong the indicator should accelerate, it should move faster and stop should get trailed aggressively.
What is strong trend?
In a bullish trend if price makes a new high it is a strong bullish trend.
In a bearish trend, if price makes a new low it is a strong bearish trend.
Period?
Period for new high: since the indicator turned bullish
Period for new low: since the indicator turned bearish
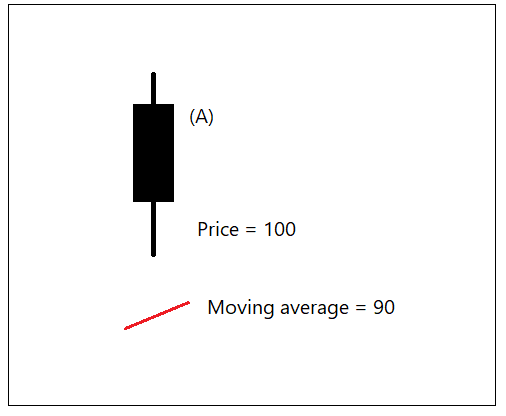
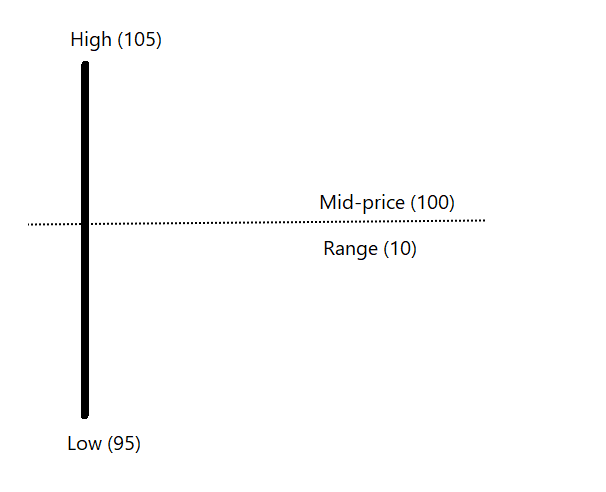
Calculation of PSAR: EP, AF and PSAR
Extreme Price (EP) is calculated on every candle.
‘High’ price in bullish market and ‘Low’ price in bearish market is called as Extreme Price (EP).
If new high is made -> EP = New High price
Else
EP = Prev High
If Bearish trend
If new low is made -> EP = New Low price
Else
EP = Prev Low
Period of new high or low is explained earlier.
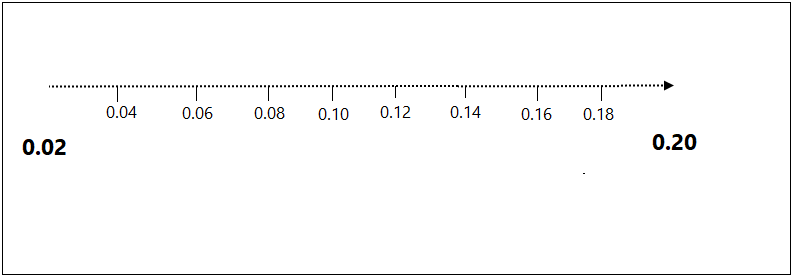
> Accelerate it by 0.02 if trend is steady.
> Add 0.02 to previous speed if trend is strong.
> Maximum acceleration will be 0.20.
Multiply Acceleration factor by A and add it to the previous stop-loss, you get new PSAR indicator reading.
PSAR = A x AF + Previous PSAR reading
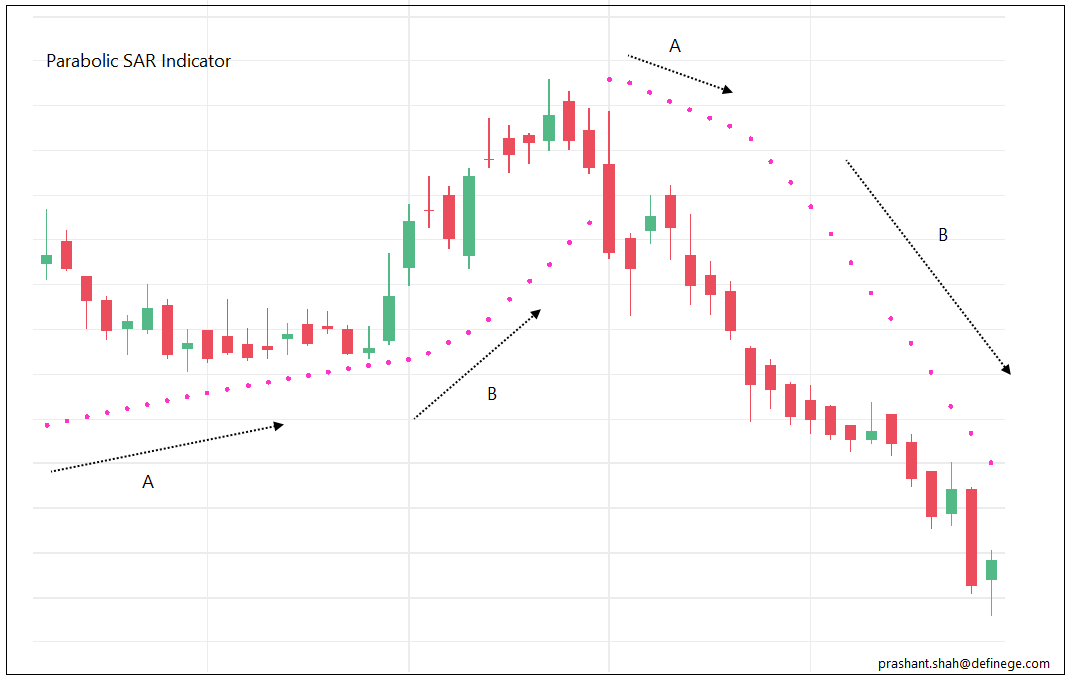
Phase A is when indicator moving at a steady speed. Phase B is when trend is strong (New high in bull market, new low in bear market) hence, PSAR is accelerating with a greater speed (0.02 being added) during B.
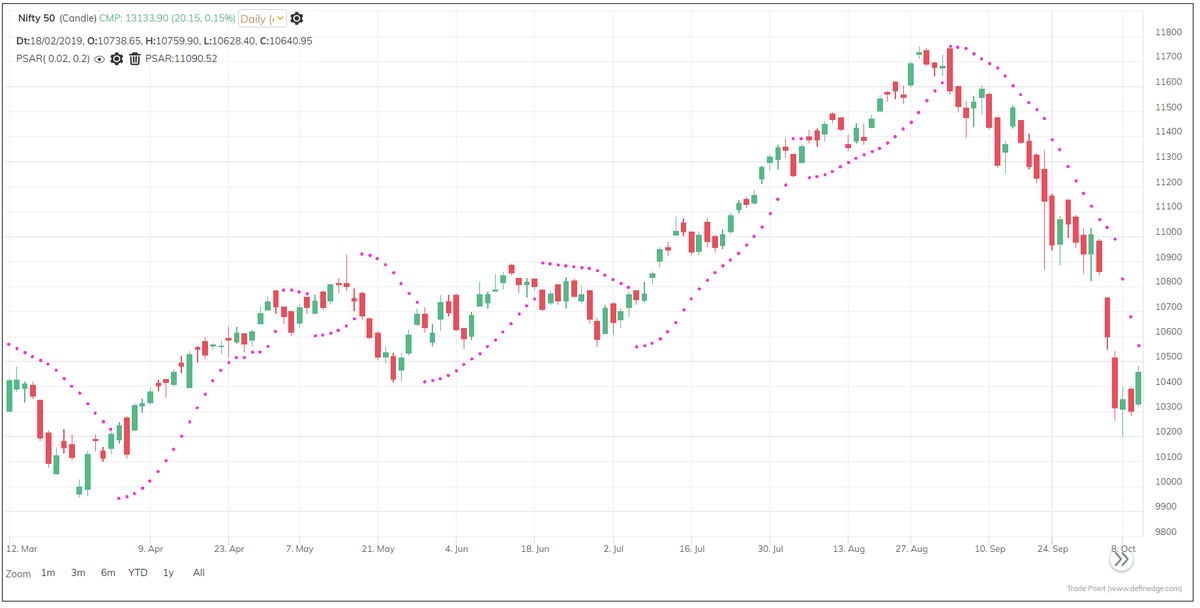
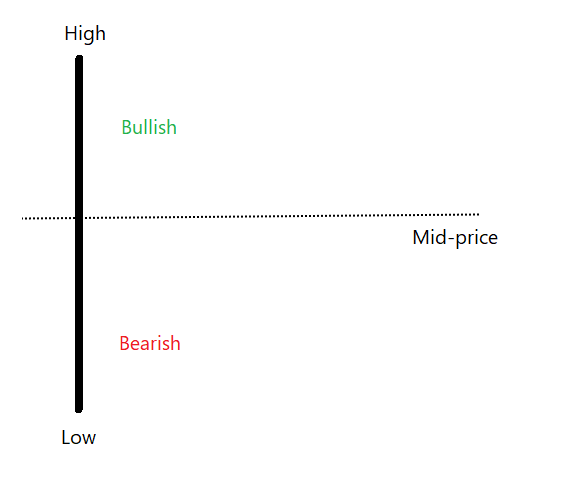
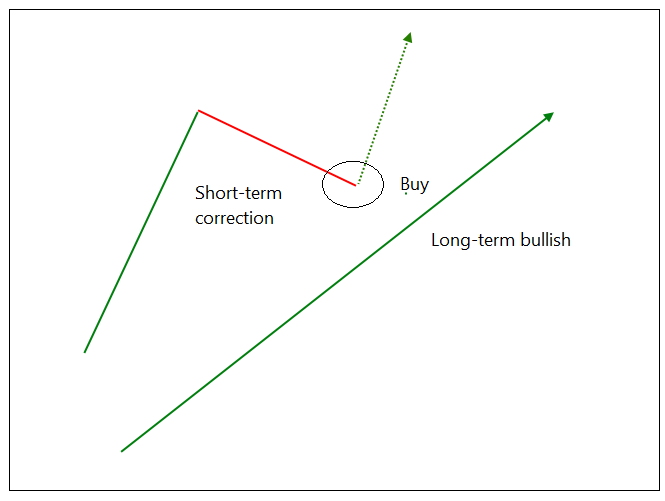
Trend is bullish when price is above the PSAR, it is bearish when price is below PSAR. You can use it as a trend filtration method.
Indicator accelerates during strong trends. Hence, rising PSAR and Falling PSAR are also important.
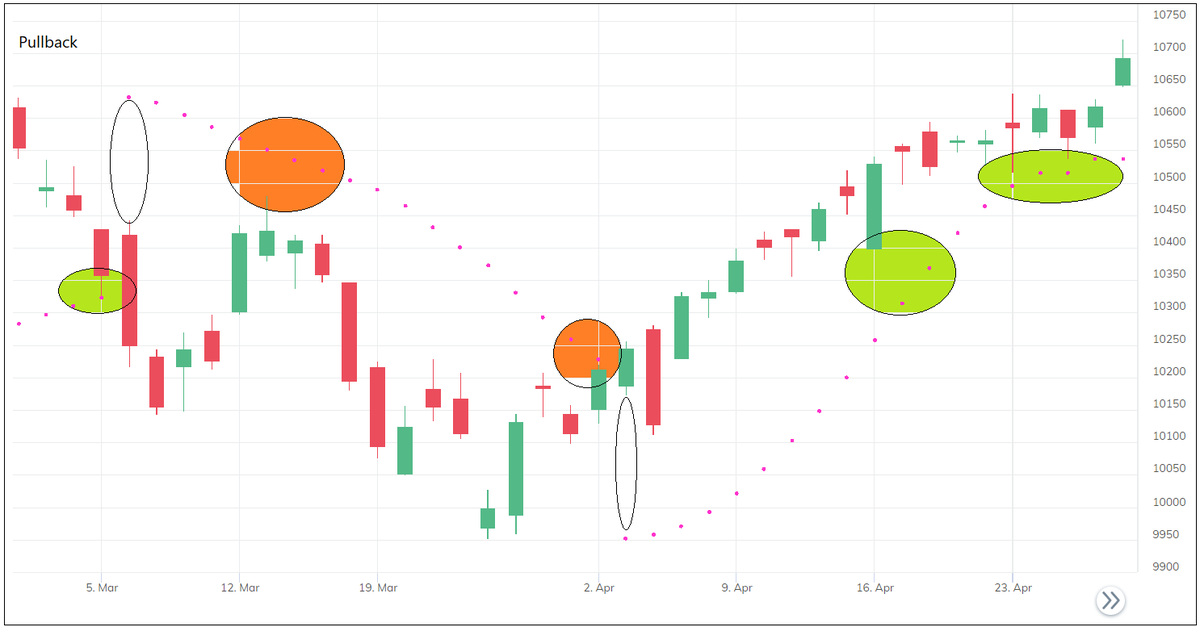
When trend changes, the length of the stop-loss depends on the previous high or low. Avoid the signal if initial stop-loss is not affordable. Wait for the pullback pattern that provides better risk-reward trade
It can be used alone or combined with other studies to design the system.
Below are some Important things about PSAR indictor:
• Unlike many other indicators, you do not have to define the look-back period, define the acceleration factor
• It does not use method of averaging
• It uses high, low prices to determine the trend and stop-loss level
• Indicator accelerates if trend is strong
More from Prashant Shah


More from Trading


TradingView isn't just charts
It's much more powerful than you think
9 things TradingView can do, you'll wish you knew yesterday: 🧵
Collaborated with @niki_poojary
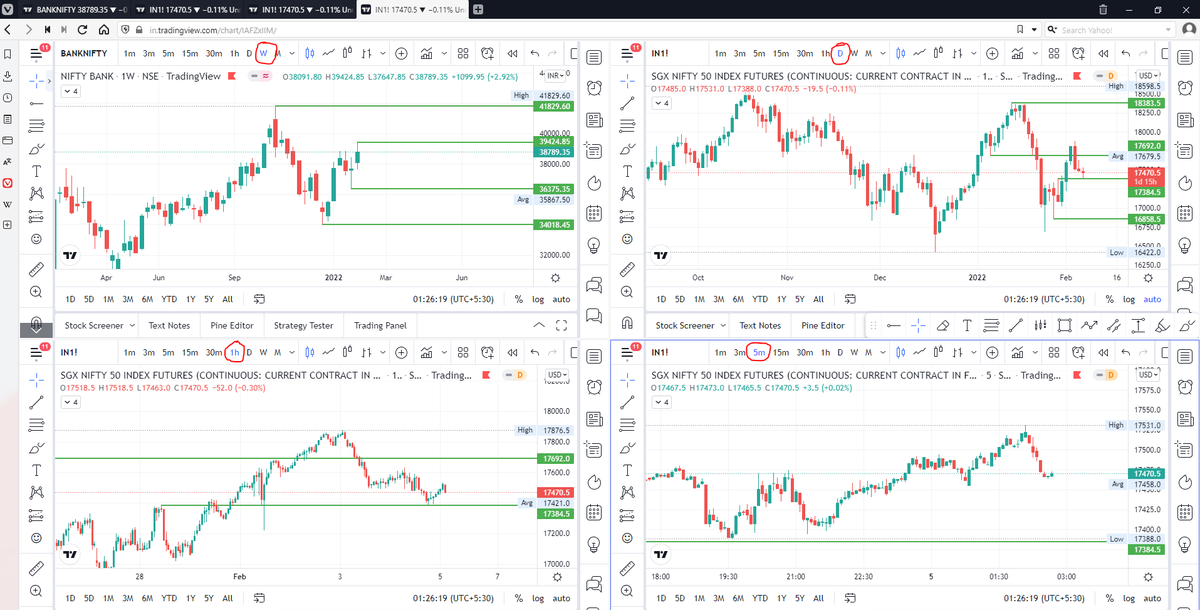
1/ Free Multi Timeframe Analysis
Step 1. Download Vivaldi Browser
Step 2. Login to trading view
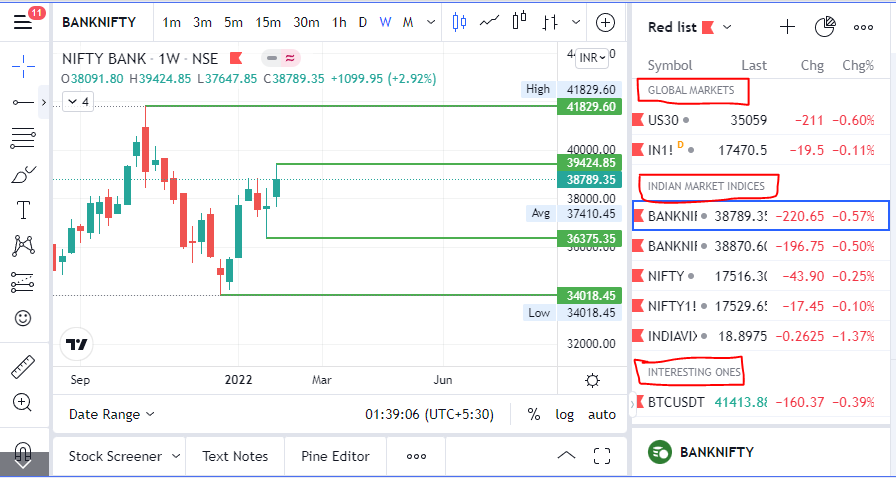
Step 3. Open bank nifty chart in 4 separate windows
Step 4. Click on the first tab and shift + click by mouse on the last tab.
Step 5. Select "Tile all 4 tabs"
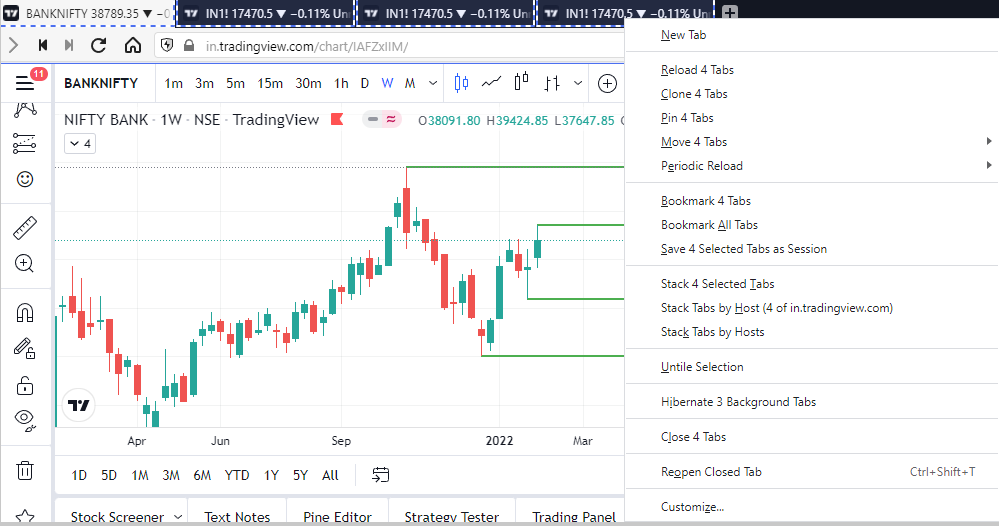
What happens is you get 4 charts joint on one screen.
Refer to the attached picture.
The best part about this is this is absolutely free to do.
Also, do note:
I do not have the paid version of trading view.
2/ Free Multiple Watchlists
Go through this informative thread where @sarosijghosh teaches you how to create multiple free watchlists in the free
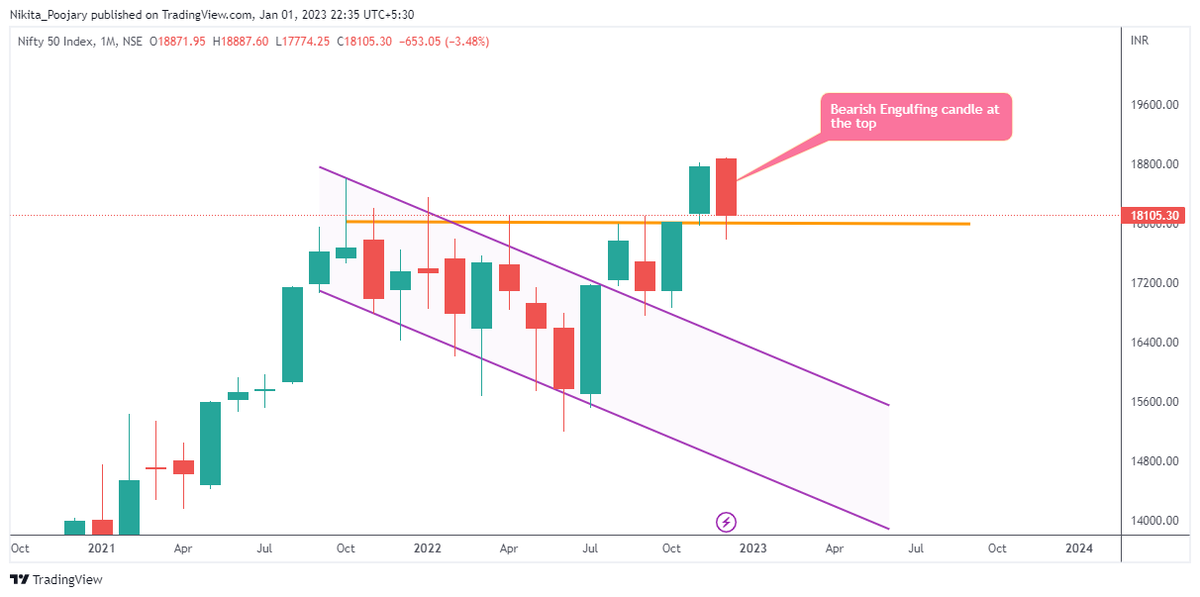
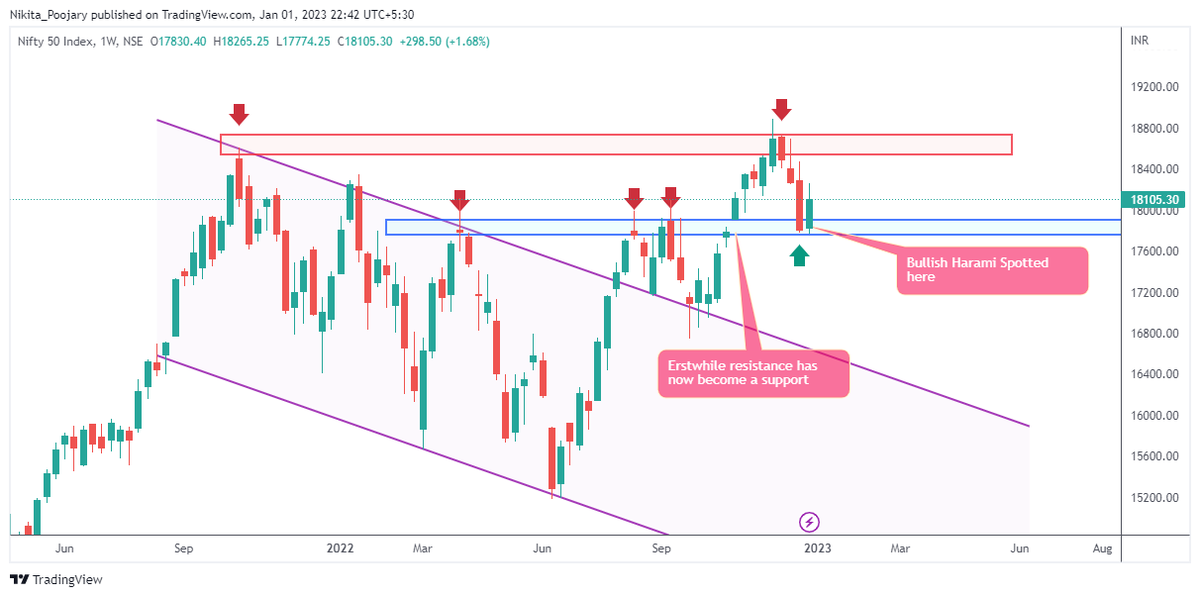
3/ Free Segregation into different headers/sectors
You can create multiple sections sector-wise for free.
1. Long tap on any index/stock and click on "Add section above."
2. Secgregate the stocks/indices based on where they belong.
Kinda like how I did in the picture below.
It's much more powerful than you think
9 things TradingView can do, you'll wish you knew yesterday: 🧵
Collaborated with @niki_poojary
1/ Free Multi Timeframe Analysis
Step 1. Download Vivaldi Browser
Step 2. Login to trading view
Step 3. Open bank nifty chart in 4 separate windows
Step 4. Click on the first tab and shift + click by mouse on the last tab.
Step 5. Select "Tile all 4 tabs"
What happens is you get 4 charts joint on one screen.
Refer to the attached picture.
The best part about this is this is absolutely free to do.
Also, do note:
I do not have the paid version of trading view.
2/ Free Multiple Watchlists
Go through this informative thread where @sarosijghosh teaches you how to create multiple free watchlists in the free
\U0001d5e0\U0001d602\U0001d5f9\U0001d601\U0001d5f6\U0001d5fd\U0001d5f9\U0001d5f2 \U0001d600\U0001d5f2\U0001d5f0\U0001d601\U0001d5fc\U0001d5ff \U0001d604\U0001d5ee\U0001d601\U0001d5f0\U0001d5f5\U0001d5f9\U0001d5f6\U0001d600\U0001d601 \U0001d5fc\U0001d5fb \U0001d5e7\U0001d5ff\U0001d5ee\U0001d5f1\U0001d5f6\U0001d5fb\U0001d5f4\U0001d603\U0001d5f6\U0001d5f2\U0001d604 \U0001d602\U0001d600\U0001d5f6\U0001d5fb\U0001d5f4 \U0001d601\U0001d5f5\U0001d5f2 \U0001d5d9\U0001d5e5\U0001d5d8\U0001d5d8 \U0001d603\U0001d5f2\U0001d5ff\U0001d600\U0001d5f6\U0001d5fc\U0001d5fb!
— Sarosij Ghosh (@sarosijghosh) September 18, 2021
A THREAD \U0001f9f5
Please Like and Re-Tweet. It took a lot of effort to put this together. #StockMarket #TradingView #trading #watchlist #Nifty500 #stockstowatch
3/ Free Segregation into different headers/sectors
You can create multiple sections sector-wise for free.
1. Long tap on any index/stock and click on "Add section above."
2. Secgregate the stocks/indices based on where they belong.
Kinda like how I did in the picture below.
You May Also Like

@franciscodeasis https://t.co/OuQaBRFPu7
Unfortunately the "This work includes the identification of viral sequences in bat samples, and has resulted in the isolation of three bat SARS-related coronaviruses that are now used as reagents to test therapeutics and vaccines." were BEFORE the

chimeric infectious clone grants were there.https://t.co/DAArwFkz6v is in 2017, Rs4231.
https://t.co/UgXygDjYbW is in 2016, RsSHC014 and RsWIV16.
https://t.co/krO69CsJ94 is in 2013, RsWIV1. notice that this is before the beginning of the project
starting in 2016. Also remember that they told about only 3 isolates/live viruses. RsSHC014 is a live infectious clone that is just as alive as those other "Isolates".
P.D. somehow is able to use funds that he have yet recieved yet, and send results and sequences from late 2019 back in time into 2015,2013 and 2016!
https://t.co/4wC7k1Lh54 Ref 3: Why ALL your pangolin samples were PCR negative? to avoid deep sequencing and accidentally reveal Paguma Larvata and Oryctolagus Cuniculus?
Unfortunately the "This work includes the identification of viral sequences in bat samples, and has resulted in the isolation of three bat SARS-related coronaviruses that are now used as reagents to test therapeutics and vaccines." were BEFORE the
chimeric infectious clone grants were there.https://t.co/DAArwFkz6v is in 2017, Rs4231.
https://t.co/UgXygDjYbW is in 2016, RsSHC014 and RsWIV16.
https://t.co/krO69CsJ94 is in 2013, RsWIV1. notice that this is before the beginning of the project
starting in 2016. Also remember that they told about only 3 isolates/live viruses. RsSHC014 is a live infectious clone that is just as alive as those other "Isolates".
P.D. somehow is able to use funds that he have yet recieved yet, and send results and sequences from late 2019 back in time into 2015,2013 and 2016!
https://t.co/4wC7k1Lh54 Ref 3: Why ALL your pangolin samples were PCR negative? to avoid deep sequencing and accidentally reveal Paguma Larvata and Oryctolagus Cuniculus?


Speech Delay is most common in children nowadays
In ancient times, our grandparents used to follow typical natural way of caring the needs of a child. All they used were more of natural products than chemical based for the growth of child.

One of major step followed was to feed Gurbach Jadd/ Vasa Kommu/ Acorus Calamus for initiating good speech ability in a child. This stem was needed to babies on Tuesdays and Sundays in mother's milk.
Vasa is feed to baby after the 1st bath on 12th day in week. Weekly only thrice it is fed and named as :
Budhwar - Budhi Vasa
Mangalwar - Vaak Vasa
Ravi Vaar - Aayush Vasa
This stem is burnt and rubbed against the grinding stone in mother's milk or warm water to get a paste
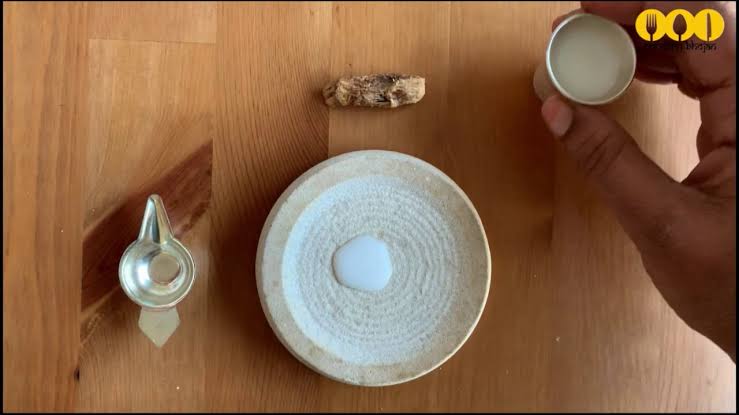
The procedure to make it is in the link
https://t.co/uo4sGp7mUm
It should not be given daily to the child. Other main benefits are
1. It clears the phlegm in child's throat caused due to continuous milk intake. It clears the tracts and breathing is effortless.
2. Digestion
For children who haven't got their speech and is delayed than usual should feed this vasa on these days in week atleast for 6months. Don't get carried away with this dialogue
"Some gain speech little late"
In ancient times, our grandparents used to follow typical natural way of caring the needs of a child. All they used were more of natural products than chemical based for the growth of child.
One of major step followed was to feed Gurbach Jadd/ Vasa Kommu/ Acorus Calamus for initiating good speech ability in a child. This stem was needed to babies on Tuesdays and Sundays in mother's milk.
Vasa is feed to baby after the 1st bath on 12th day in week. Weekly only thrice it is fed and named as :
Budhwar - Budhi Vasa
Mangalwar - Vaak Vasa
Ravi Vaar - Aayush Vasa
This stem is burnt and rubbed against the grinding stone in mother's milk or warm water to get a paste
The procedure to make it is in the link
https://t.co/uo4sGp7mUm
It should not be given daily to the child. Other main benefits are
1. It clears the phlegm in child's throat caused due to continuous milk intake. It clears the tracts and breathing is effortless.
2. Digestion
For children who haven't got their speech and is delayed than usual should feed this vasa on these days in week atleast for 6months. Don't get carried away with this dialogue
"Some gain speech little late"