I think Romans 14 helps us on the matter of wearing masks, though I am not saying that those who believe we should wear masks are weak in faith.
More from Society

1/OK, data mystery time.
This New York Times feature shows China with a Gini Index of less than 30, which would make it more equal than Canada, France, or the Netherlands. https://t.co/g3Sv6DZTDE
That's weird. Income inequality in China is legendary.
Let's check this number.
2/The New York Times cites the World Bank's recent report, "Fair Progress? Economic Mobility across Generations Around the World".
The report is available here:
3/The World Bank report has a graph in which it appears to show the same value for China's Gini - under 0.3.
The graph cites the World Development Indicators as its source for the income inequality data.

4/The World Development Indicators are available at the World Bank's website.
Here's the Gini index: https://t.co/MvylQzpX6A
It looks as if the latest estimate for China's Gini is 42.2.
That estimate is from 2012.
5/A Gini of 42.2 would put China in the same neighborhood as the U.S., whose Gini was estimated at 41 in 2013.
I can't find the <30 number anywhere. The only other estimate in the tables for China is from 2008, when it was estimated at 42.8.
This New York Times feature shows China with a Gini Index of less than 30, which would make it more equal than Canada, France, or the Netherlands. https://t.co/g3Sv6DZTDE
That's weird. Income inequality in China is legendary.
Let's check this number.
2/The New York Times cites the World Bank's recent report, "Fair Progress? Economic Mobility across Generations Around the World".
The report is available here:
3/The World Bank report has a graph in which it appears to show the same value for China's Gini - under 0.3.
The graph cites the World Development Indicators as its source for the income inequality data.
4/The World Development Indicators are available at the World Bank's website.
Here's the Gini index: https://t.co/MvylQzpX6A
It looks as if the latest estimate for China's Gini is 42.2.
That estimate is from 2012.
5/A Gini of 42.2 would put China in the same neighborhood as the U.S., whose Gini was estimated at 41 in 2013.
I can't find the <30 number anywhere. The only other estimate in the tables for China is from 2008, when it was estimated at 42.8.


Two things can be true at once:
1. There is an issue with hostility some academics have faced on some issues
2. Another academic who himself uses threats of legal action to bully colleagues into silence is not a good faith champion of the free speech cause
I have kept quiet about Matthew's recent outpourings on here but as my estwhile co-author has now seen fit to portray me as an enabler of oppression I think I have a right to reply. So I will.
I consider Matthew to be a colleague and a friend, and we had a longstanding agreement not to engage in disputes on twitter. I disagree with much in the article @UOzkirimli wrote on his research in @openDemocracy but I strongly support his right to express such critical views
I therefore find it outrageous that Matthew saw fit to bully @openDemocracy with legal threats, seeking it seems to stifle criticism of his own work. Such behaviour is simply wrong, and completely inconsistent with an academic commitment to free speech.
I am not embroiling myself in the various other cases Matt lists because, unlike him, I think attention to the detail matters and I don't have time to research each of these cases in detail.
1. There is an issue with hostility some academics have faced on some issues
2. Another academic who himself uses threats of legal action to bully colleagues into silence is not a good faith champion of the free speech cause
How about Selina Todd, Kathleen Stock, Jo Phoenix, Rachel Ara, Sarah Honeychurch, Michele Moore, Nina Power, Joanna Williams, Jenny Murray, Julia Gasper ...
— Matt Goodwin (@GoodwinMJ) February 17, 2021
Or is it only Eric you pop at?
Are they all making it up too Rob?
Are they "beyond parody"? https://t.co/drQssTD0OL
I have kept quiet about Matthew's recent outpourings on here but as my estwhile co-author has now seen fit to portray me as an enabler of oppression I think I have a right to reply. So I will.
I consider Matthew to be a colleague and a friend, and we had a longstanding agreement not to engage in disputes on twitter. I disagree with much in the article @UOzkirimli wrote on his research in @openDemocracy but I strongly support his right to express such critical views
I therefore find it outrageous that Matthew saw fit to bully @openDemocracy with legal threats, seeking it seems to stifle criticism of his own work. Such behaviour is simply wrong, and completely inconsistent with an academic commitment to free speech.
I am not embroiling myself in the various other cases Matt lists because, unlike him, I think attention to the detail matters and I don't have time to research each of these cases in detail.

Brief thread to debunk the repeated claims we hear about transmission not happening 'within school walls', infection in school children being 'a reflection of infection from the community', and 'primary school children less likely to get infected and contribute to transmission'.
I've heard a lot of scientists claim these three - including most recently the chief advisor to the CDC, where the claim that most transmission doesn't happen within the walls of schools. There is strong evidence to rebut this claim. Let's look at
Let's look at the trends of infection in different age groups in England first- as reported by the ONS. Being a random survey of infection in the community, this doesn't suffer from the biases of symptom-based testing, particularly important in children who are often asymptomatic
A few things to note:
1. The infection rates among primary & secondary school children closely follow school openings, closures & levels of attendance. E.g. We see a dip in infections following Oct half-term, followed by a rise after school reopening.
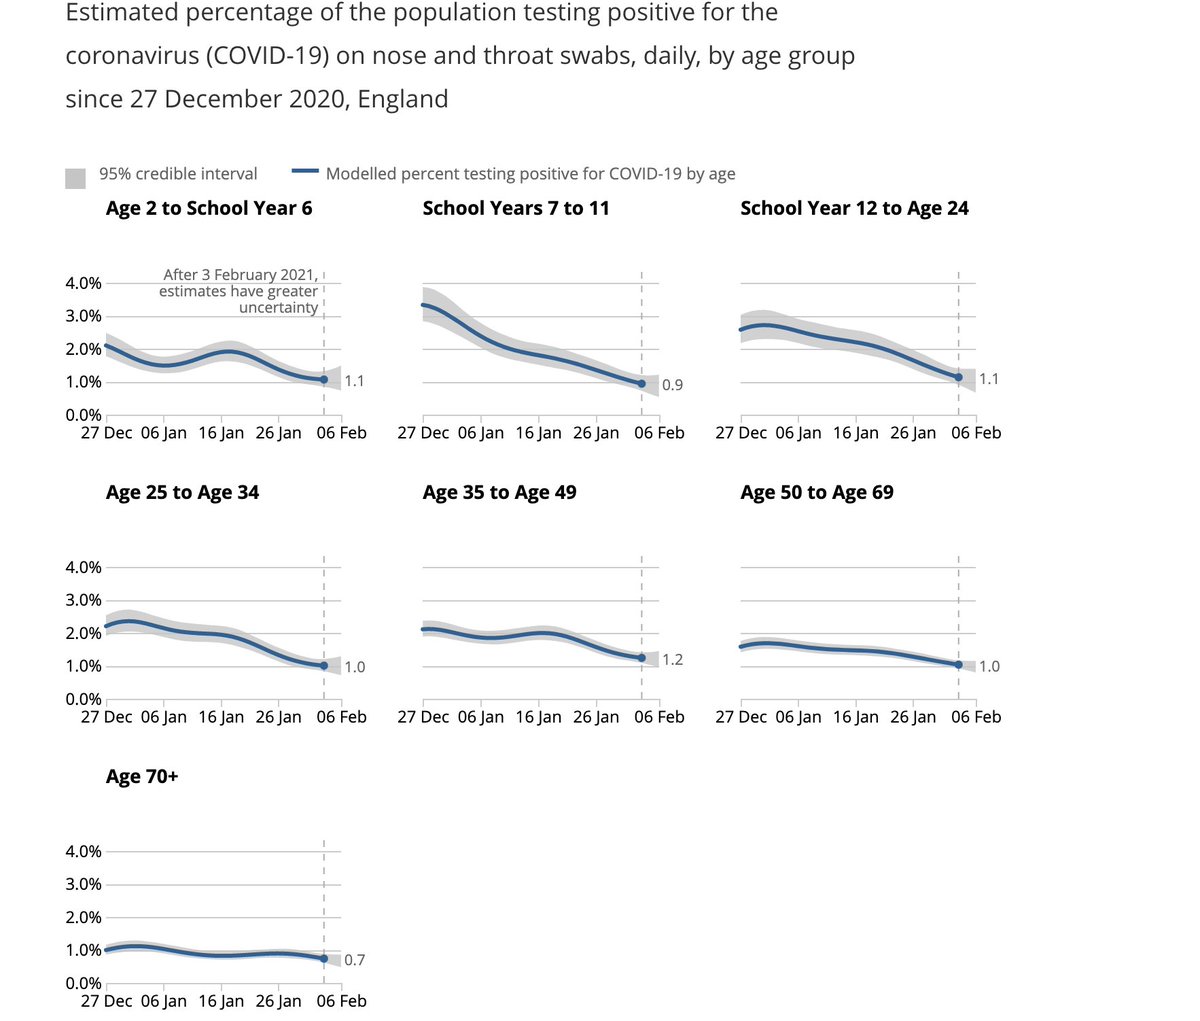
We see steep drops in both primary & secondary school groups after end of term (18th December), but these drops plateau out in primary school children, where attendance has been >20% after re-opening in January (by contrast with 2ndary schools where this is ~5%).
I've heard a lot of scientists claim these three - including most recently the chief advisor to the CDC, where the claim that most transmission doesn't happen within the walls of schools. There is strong evidence to rebut this claim. Let's look at
The science shows us that most disease transmission does not happen in the walls of the school, but it comes in from the community. So, CDC is advocating to get our K-5 students back in school at least in a hybrid mode with universal mask wearing and 6 ft of distancing. https://t.co/dfvJ2nl2s4
— Rochelle Walensky, MD, MPH (@CDCDirector) February 14, 2021
Let's look at the trends of infection in different age groups in England first- as reported by the ONS. Being a random survey of infection in the community, this doesn't suffer from the biases of symptom-based testing, particularly important in children who are often asymptomatic
A few things to note:
1. The infection rates among primary & secondary school children closely follow school openings, closures & levels of attendance. E.g. We see a dip in infections following Oct half-term, followed by a rise after school reopening.
We see steep drops in both primary & secondary school groups after end of term (18th December), but these drops plateau out in primary school children, where attendance has been >20% after re-opening in January (by contrast with 2ndary schools where this is ~5%).