A short thread on what I think is particularly useful intuition for the application of computational statistics.


More from Science

Recently I learned something about DNA that blew my mind, and in this thread, I'll attempt to blow your mind as well. Behold: Chargaff's 2nd Parity Rule for DNA N-Grams.
If you are into cryptography or reverse engineering, you should love this.
Thread:

DNA consists of four different 'bases', A, C, G and T. These bases have specific meaning within our biology. Specifically, within the 'coding part' of a gene, a triplet of bases encodes for an amino acid

Most DNA is stored redundantly, in two connected strands. Wherever there is an A on one strand, you'll find a T on the other one. And similarly for C and G:
T G T C A G T
A C A G T C A
(note how the other strand is upside down - this matters!)

If you take all the DNA of an organism (both strands), you will find equal numbers of A's and T's, as well as equal numbers of C's and G's. This is true by definition.
This is called Chargaff's 1st parity rule.
https://t.co/jD4cMt0PJ0

Strangely enough, this rule also holds per strand! So even if you take away the redundancy, there are 99% equal numbers of A/T and C/G * on each strand *. And we don't really know why.
This is called Chargaff's 2nd parity rule.

If you are into cryptography or reverse engineering, you should love this.
Thread:
DNA consists of four different 'bases', A, C, G and T. These bases have specific meaning within our biology. Specifically, within the 'coding part' of a gene, a triplet of bases encodes for an amino acid
Most DNA is stored redundantly, in two connected strands. Wherever there is an A on one strand, you'll find a T on the other one. And similarly for C and G:
T G T C A G T
A C A G T C A
(note how the other strand is upside down - this matters!)
If you take all the DNA of an organism (both strands), you will find equal numbers of A's and T's, as well as equal numbers of C's and G's. This is true by definition.
This is called Chargaff's 1st parity rule.
https://t.co/jD4cMt0PJ0
Strangely enough, this rule also holds per strand! So even if you take away the redundancy, there are 99% equal numbers of A/T and C/G * on each strand *. And we don't really know why.
This is called Chargaff's 2nd parity rule.


Read this thread from @lilithsaintcrow. I really mean it. Just read it. Because if what she is saying is true (and I happen to think it is) it explains *so much*
An example using the Flat Earthers: A thread of many parts:
I'm firmly convinced that the flat Earth thing was started by some adolescent trolls with nothing more productive to do. They didn't believe it, but they thought it was entertaining to keep pretending that they did.
You can't engage with them, because they *are playing a game*. They think it's fun to see if they can get anybody to engage with something completely stupid as though it's true.
If you challenge them, the rules of the game state that they have to argue as hard and a spuriously as they like, but *never* to admit that the Earth is not in fact flat. I suppose you have to make up your own entertainment on 4chan or whatever hole this was conceived in.
It's annoying as hell, but I suppose it doesn't do much harm.. except to folks like this:
An example using the Flat Earthers: A thread of many parts:
Let me explain something to those of you who didn't grow up around violently abusive white supremacists.
— Lili Saintcrow (@lilithsaintcrow) January 7, 2021
*They absolutely do not believe their own bullshit*, but it's useful for them to pretend they do.
I'm firmly convinced that the flat Earth thing was started by some adolescent trolls with nothing more productive to do. They didn't believe it, but they thought it was entertaining to keep pretending that they did.
You can't engage with them, because they *are playing a game*. They think it's fun to see if they can get anybody to engage with something completely stupid as though it's true.
If you challenge them, the rules of the game state that they have to argue as hard and a spuriously as they like, but *never* to admit that the Earth is not in fact flat. I suppose you have to make up your own entertainment on 4chan or whatever hole this was conceived in.
It's annoying as hell, but I suppose it doesn't do much harm.. except to folks like this:

Localized Surface Plasmon Resonance - an overview | ScienceDirect Topics
https://t.co/mzS7vVSREJ
https://t.co/353PdAX2fa
https://t.co/3yBImjOdd4
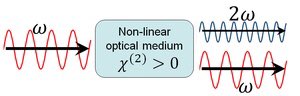
In some cases, almost 100% of the light energy can be converted to the second harmonic frequency. These cases typically involve intense pulsed laser beams passing through large crystals, and careful alignment to obtain phase matching.
https://t.co/mzS7vVSREJ
https://t.co/353PdAX2fa
https://t.co/3yBImjOdd4
In some cases, almost 100% of the light energy can be converted to the second harmonic frequency. These cases typically involve intense pulsed laser beams passing through large crystals, and careful alignment to obtain phase matching.
You May Also Like

Trending news of The Rock's daughter Simone Johnson's announcing her new Stage Name is breaking our Versus tool because "Wrestling Name" isn't in our database!
Here's the most useful #Factualist comparison pages #Thread 🧵

What is the difference between “pseudonym” and “stage name?”
Pseudonym means “a fictitious name (more literally, a false name), as those used by writers and movie stars,” while stage name is “the pseudonym of an entertainer.”
https://t.co/hT5XPkTepy #english #wiki #wikidiff
People also found this comparison helpful:
Alias #versus Stage Name: What’s the difference?
Alias means “another name; an assumed name,” while stage name means “the pseudonym of an entertainer.”
https://t.co/Kf7uVKekMd #Etymology #words
Another common #question:
What is the difference between “alias” and “pseudonym?”
As nouns alias means “another name; an assumed name,” while pseudonym means “a fictitious name (more literally, a false name), as those used by writers and movie
Here is a very basic #comparison: "Name versus Stage Name"
As #nouns, the difference is that name means “any nounal word or phrase which indicates a particular person, place, class, or thing,” but stage name means “the pseudonym of an
Here's the most useful #Factualist comparison pages #Thread 🧵
What is the difference between “pseudonym” and “stage name?”
Pseudonym means “a fictitious name (more literally, a false name), as those used by writers and movie stars,” while stage name is “the pseudonym of an entertainer.”
https://t.co/hT5XPkTepy #english #wiki #wikidiff
People also found this comparison helpful:
Alias #versus Stage Name: What’s the difference?
Alias means “another name; an assumed name,” while stage name means “the pseudonym of an entertainer.”
https://t.co/Kf7uVKekMd #Etymology #words
Another common #question:
What is the difference between “alias” and “pseudonym?”
As nouns alias means “another name; an assumed name,” while pseudonym means “a fictitious name (more literally, a false name), as those used by writers and movie
Here is a very basic #comparison: "Name versus Stage Name"
As #nouns, the difference is that name means “any nounal word or phrase which indicates a particular person, place, class, or thing,” but stage name means “the pseudonym of an