Surveys with self-selecting samples, in this case, both from FairFuelUK + cycling advocates, should not be represented as the views of all of those groups; same goes for claiming data represents "Tory voters".
And that's without even mentioning the survey's leading questions.
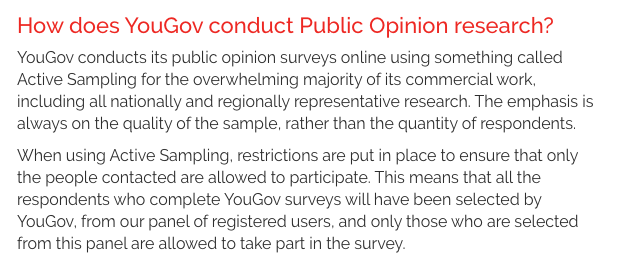
Polls can make for really interesting stories and are commonplace in media. YouGov, a key player, vets the questions and ensures they don't lead, and gets answers from a statistically representative sample to reflect the views of all GB adults.
You've probably seen the stories: X% of Brits think X. The sample size is over 2,000 and the methodology means they'd be confident the output would be the same, even if the number of people surveyed increased.
They ensure each demographic is represented as per the population.
I've worked with YouGov to conduct polls like this, most recently for
@BikeIsBestHQ. Our nationally representative survey looked like this.
- 62% used their cars as first choice for errands
- Just 5% cycled
- 78% agreed the environment would be better if more people cycled
Really importantly, though, it showed - like lots of other statistically representative surveys - that:
- 77% of adults support measures in their local area to encourage walking and cycling
- This doesn't differ hugely based on social grade or region
YouGov also asked questions on children playing in the street - a topic we thought was interesting because of a perceived increase in discourse on Low Traffic Neighbourhoods. 65% agreed "Children should be able to play in the street without danger from cars cutting through."
The #BikeIsBest campaign was interested if the developing media narrative (which has accelerated somewhat since) would make people believe they were unusual in supporting cycling. We worked with Dr
@ianwalker on this, which produced the following insights.
This is the pluralistic ignorance phenomenon. It is clear from the plot that respondents underestimated how much other people agreed that more cycling would be good for the country and overestimated how much other people disagreed with this.
You might have seen our graphic which shows the overall support, which came from the data here. It was shared widely thanks to support from
@Chris_Boardman, @London_Cycling, @WeAreCyclingUK, @BritishCycling and all the great people out there who want to make our streets safer.
The point of this thread is that it is essential research is conducted ethically, this includes working with external third parties who can ensure this is the case. The results need to be reputable so that media trust them. Or at least that's *supposed* to be how it works.
The work above took several weeks to assess and analyse by professionals, and we didn't close the survey early so that we could give an exclusive to the Mail on Sunday to suit the timing of their agenda.
Compare what you've read here with what you've seen from FairFuelUK.
Finally, what's happening in media isn't fair. But I hardly think policymakers are shaking in their boots 'cos they also understand how polls work (politics relies on them heavily).
I'm sure they'd trust YouGov, who make successful political predictions, more so than Fair Fuel.
And we always need to remember, the middle ground - normal folk who just want to live their lives, feed their families, do good etc, generally support measures for active travel. The DfT's own credible research supports this too:
https://t.co/QxjNGx8xYD
Thanks for reading. Thanks to
@ianwalker for his help with our analysis, thanks
@lastnotlost for the survey vid, thanks to YouGov for doing a great job, thanks to our #BikeIsBest partners. And thanks to all journalists who take use of data and opinion seriously. This is the end.