1. Where To Start
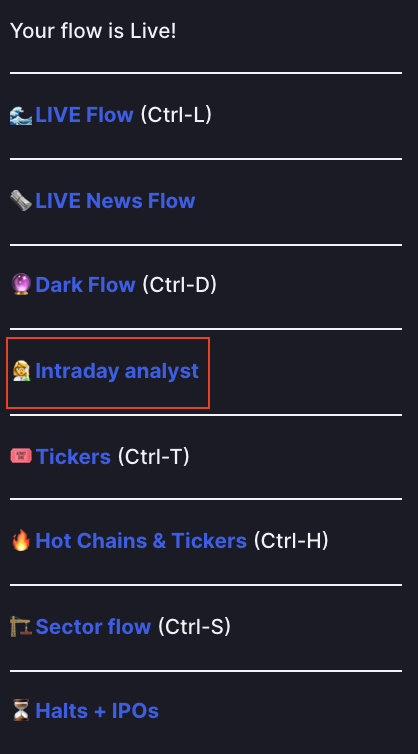
Start with the "Hot Chains & Tickers" page. Not only does this display the tickers with the most option volume, but it also shows the most active chains. Better yet, you can filter by sector and market cap.
Below are some specific filter examples:
2. Analysis
The "Intraday Analyst" page is your best friend here. The first thing I do is scroll down to the "Most Active Chains" table.
I'm looking for short-term exp. OTM contracts with heavy volume that look "unusual."
Examples are included below:
$LCID - Closed Wed. 11/3 ~$36.50. 40c weeklies required a 10% move in 2 days to go ITM. $LCID closed at $41.80 on Friday.
$AMD - Closed Tues. 11/2 ~$127.60. 130c got hit hard. Closed the week over $136.
$NVDA - Closed Thurs. 10/28 ~249.40, 250c 🔨. Closed Friday ~255.70.
Weekly OTM strikes with heavy volume can lead to huge moves. Now what makes these so unusual?
- OTM with little time to exp. = urgency
- Heavy volume on a certain strike can mean volatility in that area = good for options
- Vol. much greater OTM than ATM = big move possibility
Now it is crucial to note that volume includes both buying and selling. Suppose much of the action on a chain is selling volume. This would be bearish. However, in short-term options trading, you need volatility. Volume is what you want.
Read:
https://t.co/jaWI8lo1tX
Staying on the "Intraday Analyst" page:
This is right above the previous table. What strikes are being targeted for 11/12 exp. on $LCID? I can see that 40c had heavy action. Friday 11/5 closed at almost $42 so that makes sense.
But the 45c volume and OI grabs my attention.
I can confirm this by checking the most active chains. The highest volume OTM option on Fri. 11/5 for 11/12 exp. was in fact the 11/12 45c.
Going into Monday 11/8, I can logically have $LCID 45c on my watchlist without even looking at the chart yet.
3. Targeted Flow Fliters
If I'm looking to play weeklies, I'll simply filter to only weekly expiry. Then I'll toggle the minimum premium in the "Premium Range" based on the stock. I'll focus mainly on the "🐂 V 🐻 Prems" chart.
Min. premium examples in order: 100k, 150k, 200k.
In each of these three situations, bullish premiums are over 60%, which is a bullish sign. Being concerned with the short-term move (weekly), this process has been the most simple and understandable when it comes to recent large orders.
4. Conclusion
No tool is a crystal ball. Unusual Whales gives you the opportunity to view, analyze, and customize more data than you could ever ask for. It will take a day or two to figure everything out, but it can be very rewarding.
Unusual Whales is a game-changer when it comes to catching big moves BEFORE they happen.
These tools empower retail traders by enabling us to follow the flow. 🌊
To subscribe (and support me), click the link below! Or use code: adamslivertrade
🐳🌊🐳🌊
https://t.co/rqAUOJPROA