
Thread about what I've been doing and what I've found trying to trade options. All of this was inspired by @AdamSliverTrade @drippy2hard @WealthBrah .


More from Tradingthread


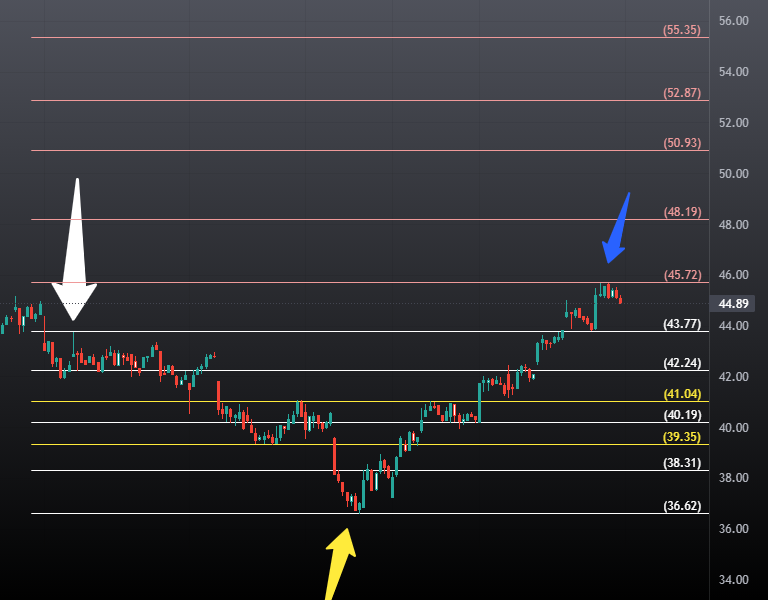


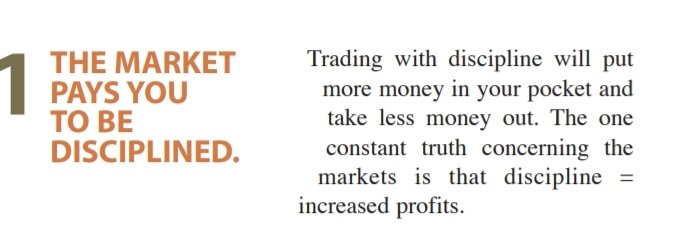
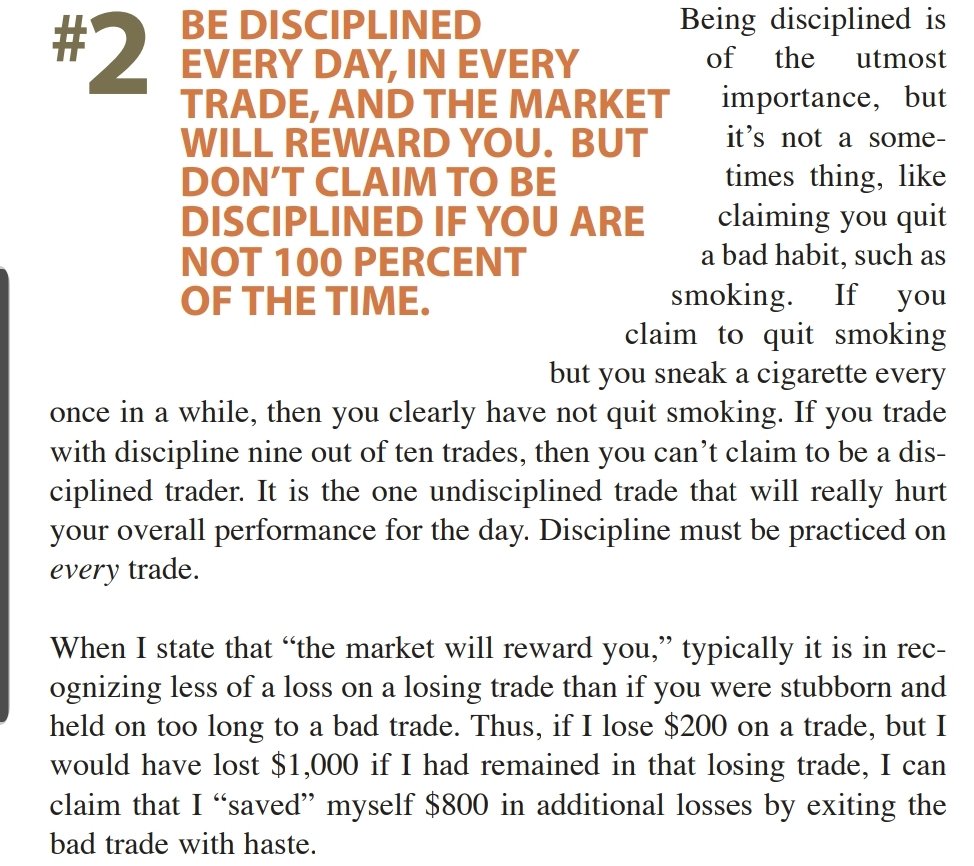
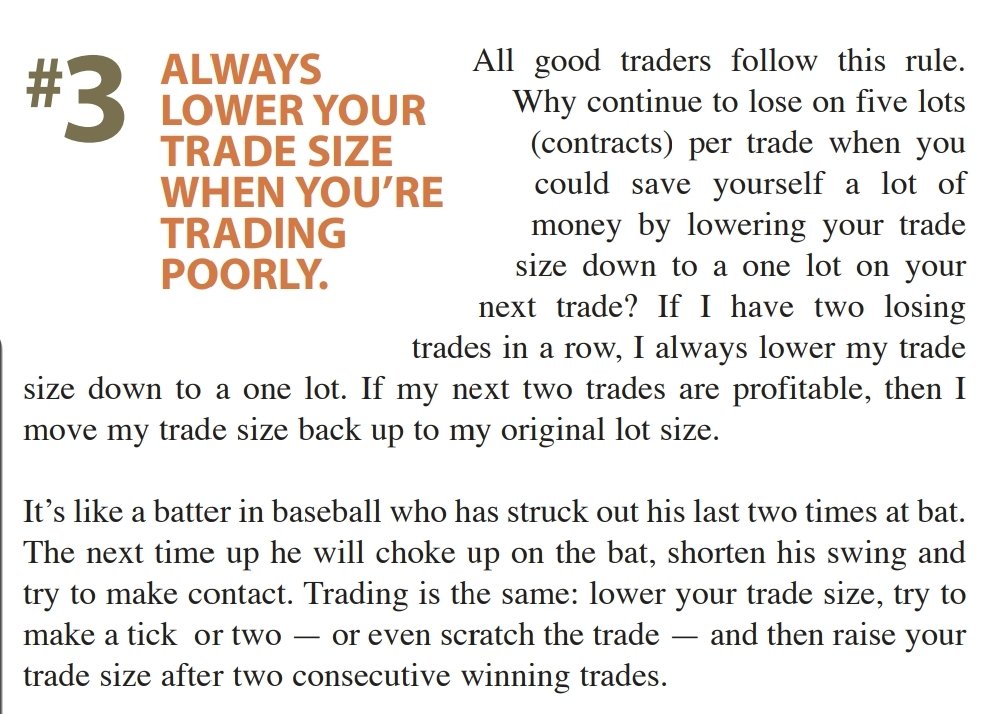
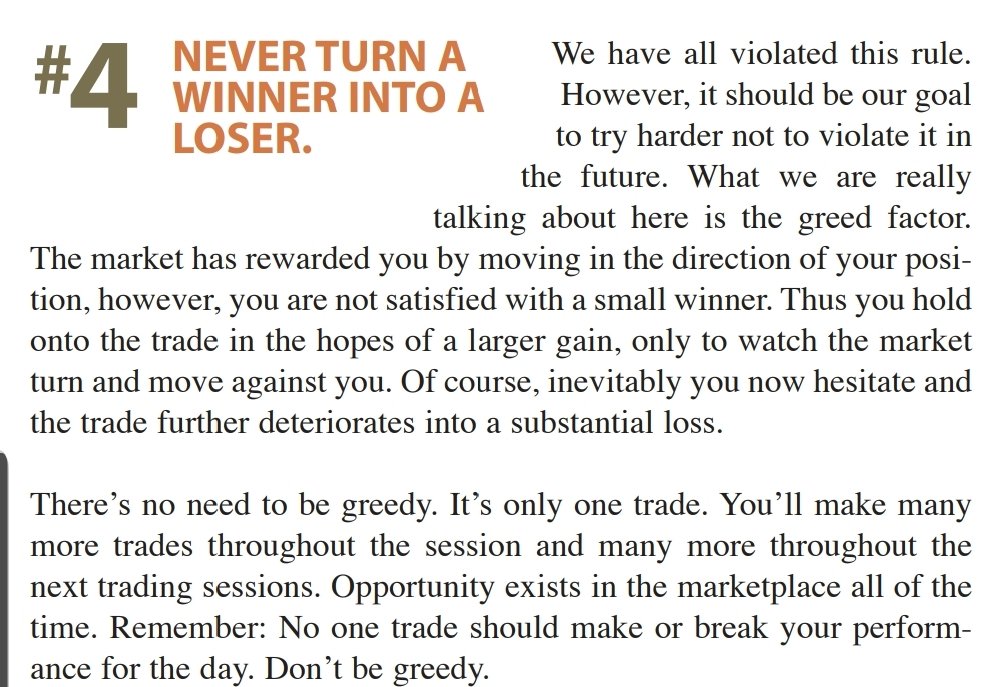
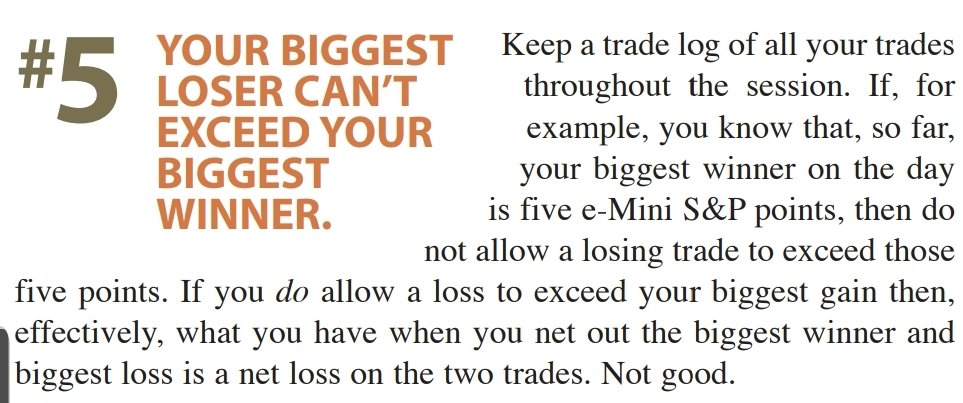


A mega thread, this contains some of my popular threads which may help you in your trading.
Thanks for reading :)
Pyramiding
Don't change your trading
Trendlines
Scaling in-out
Thanks for reading :)
Pyramiding
A thread on Pyramiding- pic.twitter.com/8EOSSFMZ2w
— Trader knight (@Traderknight007) December 27, 2020
Don't change your trading
"Don't change the trading rules after every trade."
— Trader knight (@Traderknight007) November 29, 2020
If you do change them frequently then this thread is for you.
Let's talk about the law of large numbers and how it benefits traders to be profitable.
[Thread]\U0001f447\U0001f447\U0001f447 pic.twitter.com/pEUr0wH354
Trendlines
A thread on Trend-lines pic.twitter.com/GsLGzl8A3c
— Trader knight (@Traderknight007) January 2, 2021
Scaling in-out
A thread on SCALING IN - OUT METHOD - pic.twitter.com/bJ1N5ZjAiK
— Trader knight (@Traderknight007) January 9, 2021
You May Also Like






Great article from @AsheSchow. I lived thru the 'Satanic Panic' of the 1980's/early 1990's asking myself "Has eveyrbody lost their GODDAMN MINDS?!"
The 3 big things that made the 1980's/early 1990's surreal for me.
1) Satanic Panic - satanism in the day cares ahhhh!
2) "Repressed memory" syndrome
3) Facilitated Communication [FC]
All 3 led to massive abuse.
"Therapists" -and I use the term to describe these quacks loosely - would hypnotize people & convince they they were 'reliving' past memories of Mom & Dad killing babies in Satanic rituals in the basement while they were growing up.
Other 'therapists' would badger kids until they invented stories about watching alligators eat babies dropped into a lake from a hot air balloon. Kids would deny anything happened for hours until the therapist 'broke through' and 'found' the 'truth'.
FC was a movement that started with the claim severely handicapped individuals were able to 'type' legible sentences & communicate if a 'helper' guided their hands over a keyboard.
For three years I have wanted to write an article on moral panics. I have collected anecdotes and similarities between today\u2019s moral panic and those of the past - particularly the Satanic Panic of the 80s.
— Ashe Schow (@AsheSchow) September 29, 2018
This is my finished product: https://t.co/otcM1uuUDk
The 3 big things that made the 1980's/early 1990's surreal for me.
1) Satanic Panic - satanism in the day cares ahhhh!
2) "Repressed memory" syndrome
3) Facilitated Communication [FC]
All 3 led to massive abuse.
"Therapists" -and I use the term to describe these quacks loosely - would hypnotize people & convince they they were 'reliving' past memories of Mom & Dad killing babies in Satanic rituals in the basement while they were growing up.
Other 'therapists' would badger kids until they invented stories about watching alligators eat babies dropped into a lake from a hot air balloon. Kids would deny anything happened for hours until the therapist 'broke through' and 'found' the 'truth'.
FC was a movement that started with the claim severely handicapped individuals were able to 'type' legible sentences & communicate if a 'helper' guided their hands over a keyboard.









So it's now October 10, 2018 and....Rod Rosenstein is STILL not fired.
He's STILL in charge of the Mueller investigation.
He's STILL refusing to hand over the McCabe memos.
He's STILL holding up the declassification of the #SpyGate documents & their release to the public.
I love a good cover story.......
The guy had a face-to-face with El Grande Trumpo himself on Air Force One just 2 days ago. Inside just about the most secure SCIF in the world.
And Trump came out of AF1 and gave ol' Rod a big thumbs up!
And so we're right back to 'that dirty rat Rosenstein!' 2 days later.
At this point it's clear some members of Congress are either in on this and helping the cover story or they haven't got a clue and are out in the cold.
Note the conflicting stories about 'Rosenstein cancelled meeting with Congress on Oct 11!"
First, rumors surfaced of a scheduled meeting on Oct. 11 between Rosenstein & members of Congress, and Rosenstein just cancelled it.
He's STILL in charge of the Mueller investigation.
He's STILL refusing to hand over the McCabe memos.
He's STILL holding up the declassification of the #SpyGate documents & their release to the public.
I love a good cover story.......
The guy had a face-to-face with El Grande Trumpo himself on Air Force One just 2 days ago. Inside just about the most secure SCIF in the world.
And Trump came out of AF1 and gave ol' Rod a big thumbs up!
And so we're right back to 'that dirty rat Rosenstein!' 2 days later.
At this point it's clear some members of Congress are either in on this and helping the cover story or they haven't got a clue and are out in the cold.
Note the conflicting stories about 'Rosenstein cancelled meeting with Congress on Oct 11!"
First, rumors surfaced of a scheduled meeting on Oct. 11 between Rosenstein & members of Congress, and Rosenstein just cancelled it.
Rep. Andy Biggs and Rep. Matt Gaetz say DAG Rod Rosenstein cancelled an Oct. 11 appearance before the judiciary and oversight committees. They are now calling for a subpoena. pic.twitter.com/TknVHKjXtd
— Ivan Pentchoukov \U0001f1fa\U0001f1f8 (@IvanPentchoukov) October 10, 2018