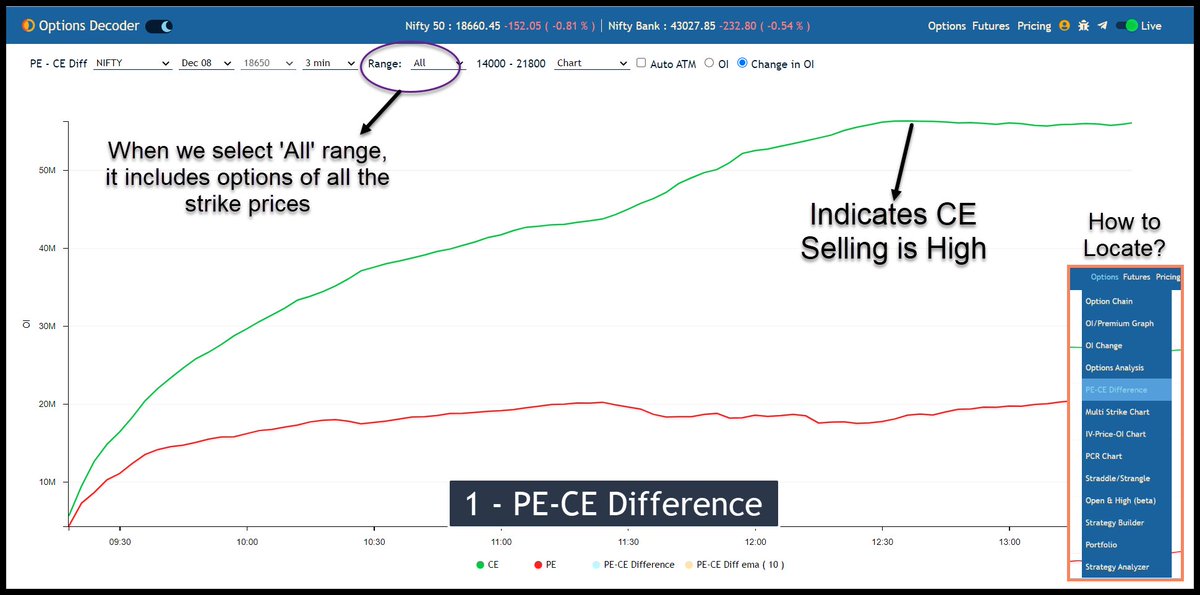
This feature combines the OI of call options and put options and plots against each other.
At one glance, we can know what big players are doing!
(If they are selling more CE means, they are bearish on the underlying instrument)
(2/N)




5: When to play directional:
— Nikita Poojary (@niki_poojary) December 18, 2022
Whenever the index is moving in a single direction, its important to go with the trend.
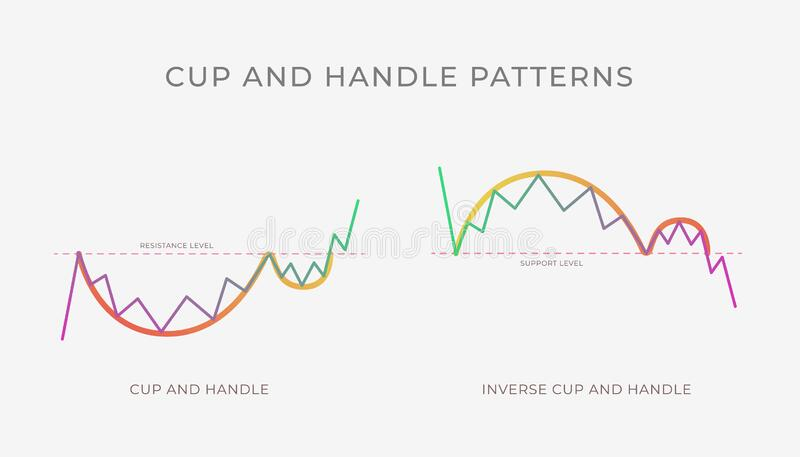
A few weeks ago when BNF broke out of the cup and handle pattern, all we had to do was sell PEs.
Pls note: weekly TF chart is attached to just show the C&H BO pic.twitter.com/z0wgUzJW8t
#VOLTAS Another cup & handle pattern for cash positional pic.twitter.com/Jsc99xJfwY
— Nikita Poojary (@niki_poojary) October 23, 2019
The stock exploded & went up as much as 63% from my price.
— Manas Arora (@iManasArora) June 22, 2020
Closed my position entirely today!#BroTip pic.twitter.com/CRbQh3kvMM
What an extended (away from averages) move looks like!!
— Manas Arora (@iManasArora) June 24, 2020
If you don't learn to sell into strength, be ready to give away the majority of your gains.#GLENMARK pic.twitter.com/5DsRTUaGO2
#HIKAL
— Manas Arora (@iManasArora) July 2, 2021
Closed remaining at 560
Reason: It is 40+% from 10wma. Super extended
Total revenue: 11R * 0.25 (size) = 2.75% on portfolio
Trade closed pic.twitter.com/YDDvhz8swT
When you see 15 green weeks in a row, that's the end of the move. *Extended*
— Manas Arora (@iManasArora) August 26, 2019
Simple price action analysis.#Seamecltd https://t.co/gR9xzgeb9K