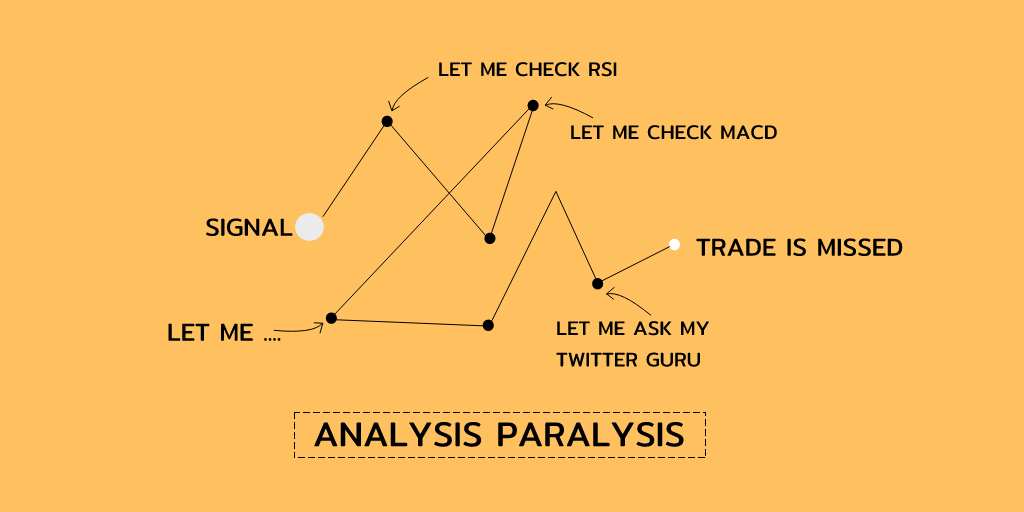
What is Analysis paralysis?
In simple terms, analysis paralysis is a person's tendency to over-analyze or over-think upon a decision to such an extent that he/she fails to make a choice resulting in a paralyzed state of inaction.
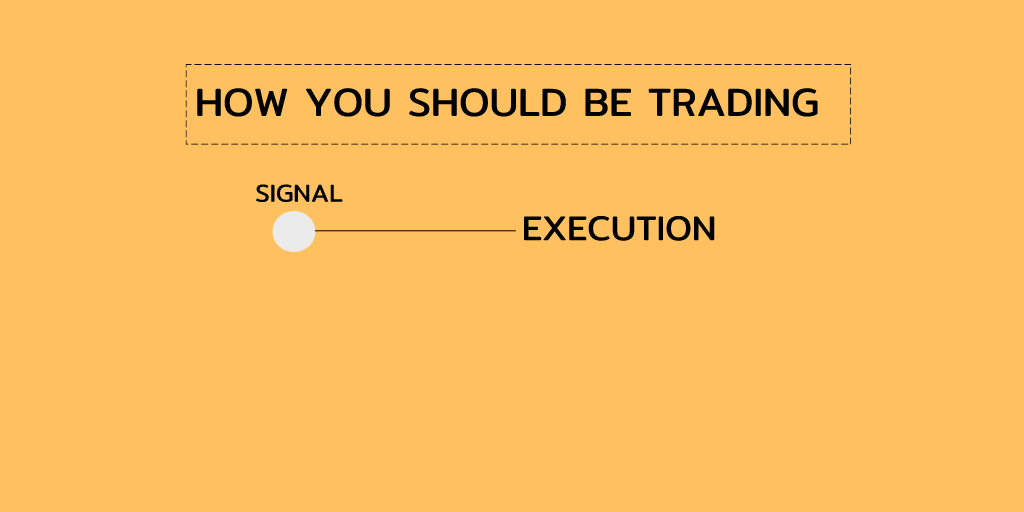
How a retail trader trades-
A trader named Rahul, He know all the basics of markets, He also has made a system which gives signals on nifty, he has also encorporated good Risk management and Position sizing into his system.
One day he gets a signal to buy Nifty at 13500 with stop at 13450, he wanted to take the trade, but he wanted to get sure that the trade he has take should be a winner.
So he says just let me check the RSI if its above this level I will buy , he checks it and it was above his
level, then again he wants to check another indicator named MACD, he wanted to get sure man, Now he do the most intelligent thing to get sure he gets right.
He goes to twitter and ask his twitter Friend Trader knight he ask him that should I buy nifty at 13500,
Trader knight says nifty is already at 13550 , Rahul says in order to be sure he lost his trade.
So, this is story of many Traders out their.
How to get rid of this Analysis Paralysis-
1. You want to get right on every trade.
This is the biggest problem because of which you are going into this loop of checking all the boxes which weren't even in your list.
Ask yourself why you want to be right every time?
Even when you know you can make big money even when you are right 30-40% of the time.
Whenever we have a setup, the first thing we can start telling to ourselves is that “this is going to be a losing trade and I am going to get stopped out on this” . We EXPECT to lose on this trade but we don’t HOPE to.
There is a difference between expecting and hoping. We HOPE to win on this trade but we don’t expect to. When we lose, we are ok as we expect and prepare for it.
When we do win, we give a pat on our shoulder since we expected to lose. Tomorrow we will start all over again
– again expect to lose but hope to win.
Think about it, only you have the answer to this problem.
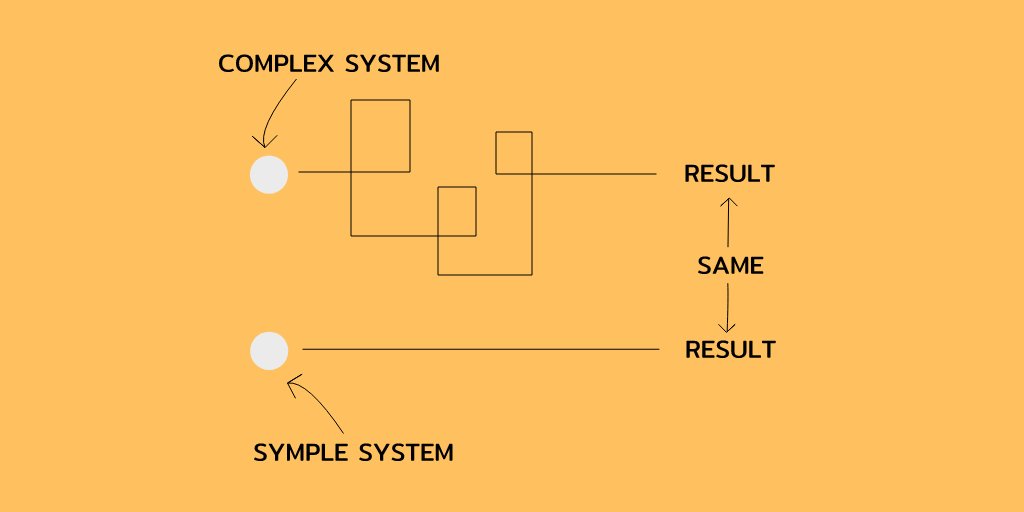
2. KISS- Keep it simple stupid, Its not necessary that only a complex system will make money , simple systems are less prone to the analysis paralysis problem.
3. You don’t have much experience (if you are a dicretionary trader) or you have not backtested your strategy, because of which you may face this analysis paralysis problem.
4. You are afraid of losing money, this is one of the biggest reason traders have this analysis paralysis
There could be many reasons you are fearing losing-
1. You are trading with scared money.
2. You are trading too big.
Thanks for reading till here.
Cheers,
TRADER KNIGHT