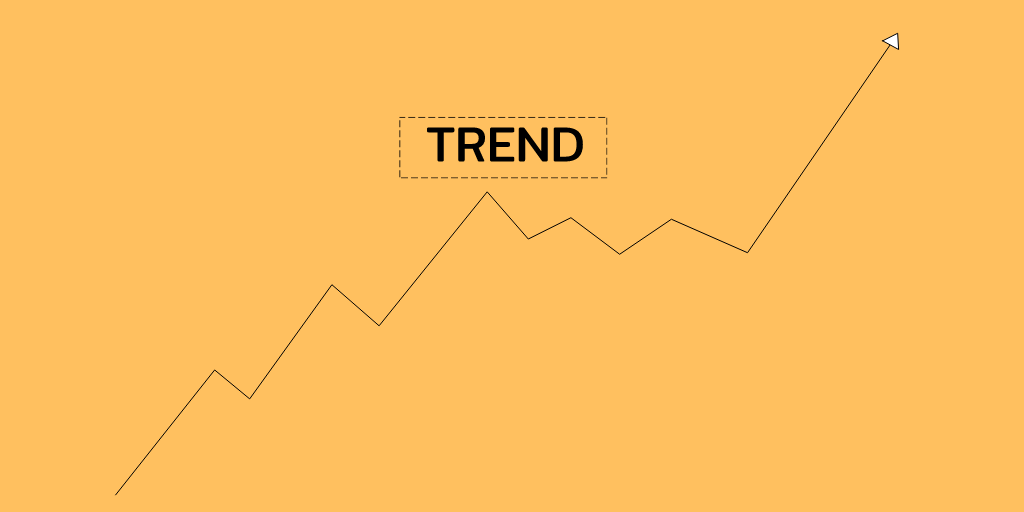
A trend is a path of least resistance, basically the side where the smart money is betting upon.
And our work is to be on their side, to make some money.
Why do we use trend?
In an uptrend, the sum of the rallies will always be greater than the sum of the declines.
In a downtrend, the sum of the declines will always be greater than the sum of the rallies.
How to Find the trend?
There are 3 methods which one can use-
1. Swing points method.
2. Moving averages.
3. Trend lines, channels.
1. Trend identification by using swing points-
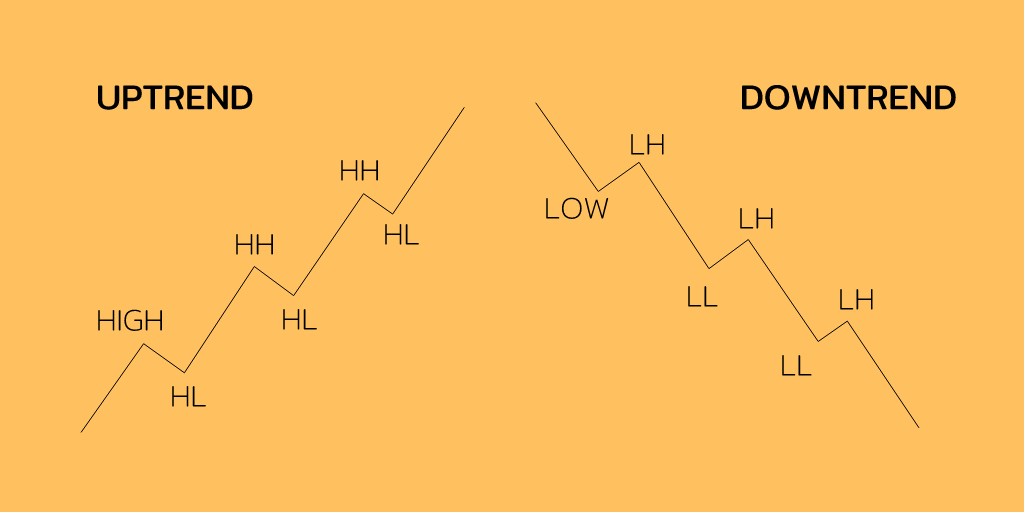
• UPTREND in simple words - Higher highs, higher lows
• DOWNTREND in simple words - lower lows, lower highs.
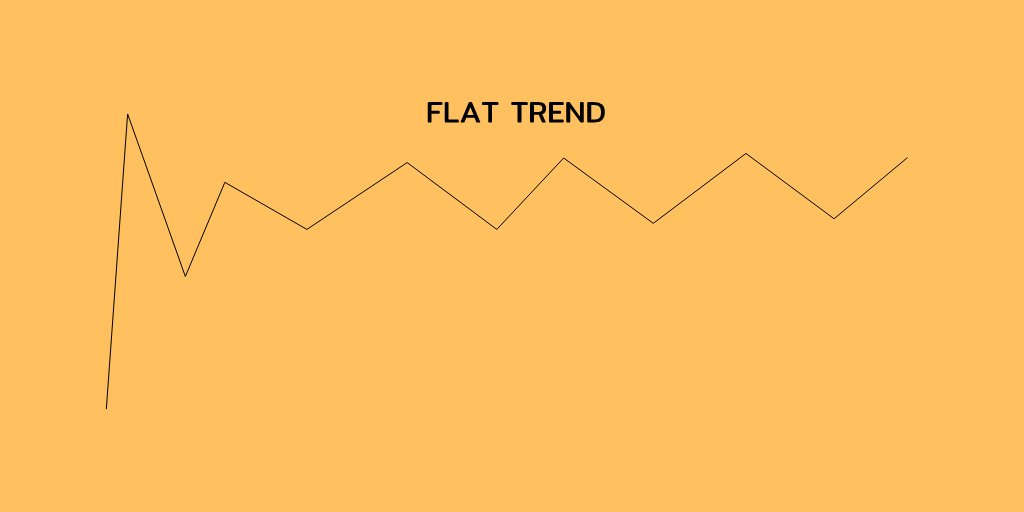
• Flat trend - The price stays in a range
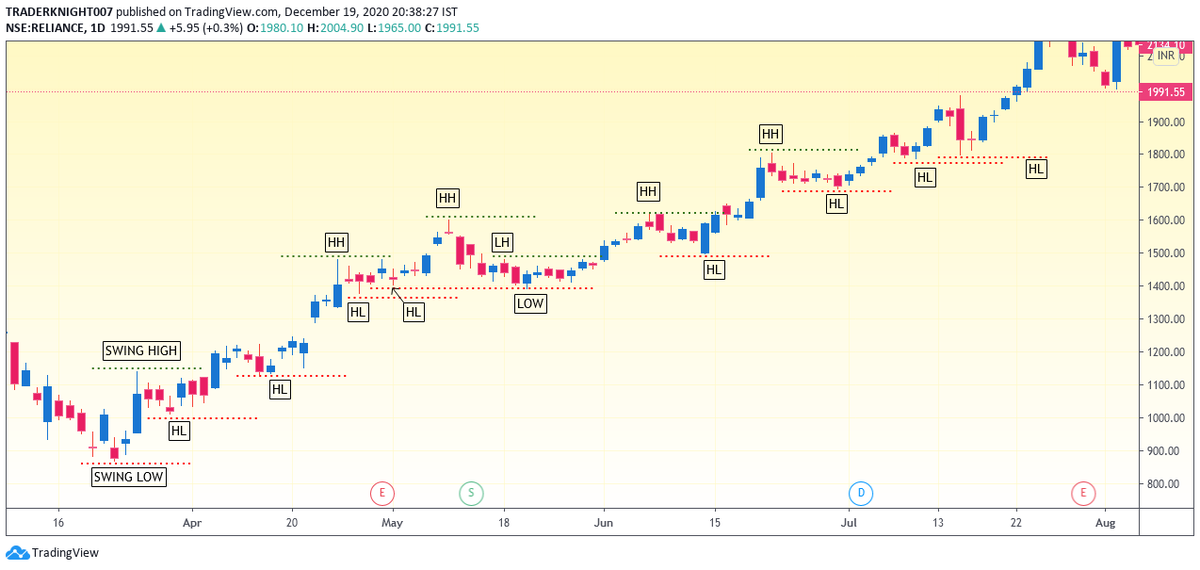
In above chart you can see the stock making a series of higher high and highs.
HH- Higher high
HL- Higher low
LH- Lower high
LL- Lower low
But you can also see that in between there was a pint where the stock made a lower high and a low.
So there will always be wip-saws like that, even in a trend.
But after that again the stock makes a new Higher high and Higher low for many times.
Also , there are points which are visible to naked eyes as they are big swing highs and lows,
but there are also some points which are hidden lows and highs.
So this is how a trend looks like.
But, if one wants to make a system out of it, then how would he take the swing points, in hindsight they are visible to us easily.
In a system we make rules for swing points.
HOW TO FIND SWING HIGHS AND LOWS -
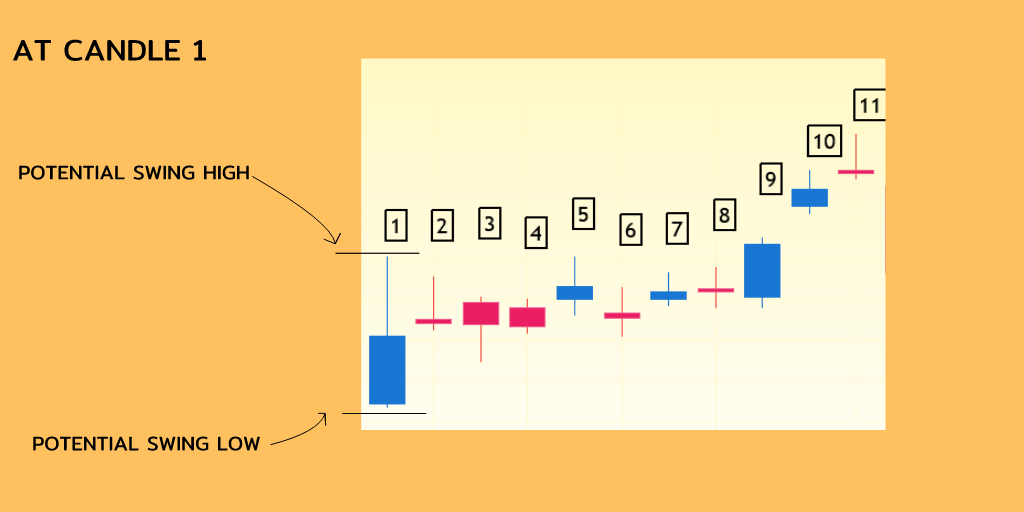
Every candles high and low is a potential swing high and a potential swing low.
until the next candle breaks above or below the highs or lows of the current candle.
We wait for 5 candles to consider a potential swing low to be an actual swing point low,
if a potential swing point is not broken by a candle high or low till 5 candles then the point is considered as actual swing point.
Some people also use 2 or 3 or even more candles to consider a swing point.
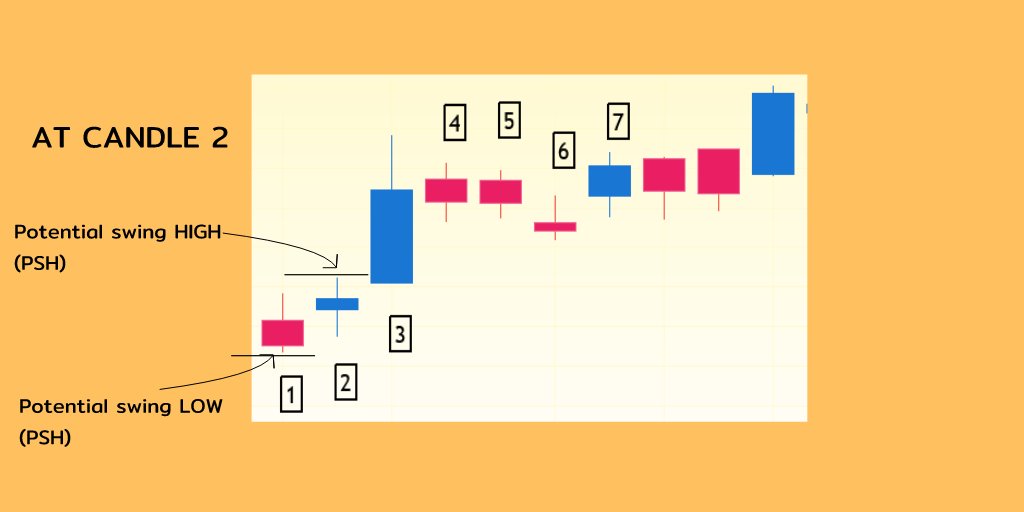
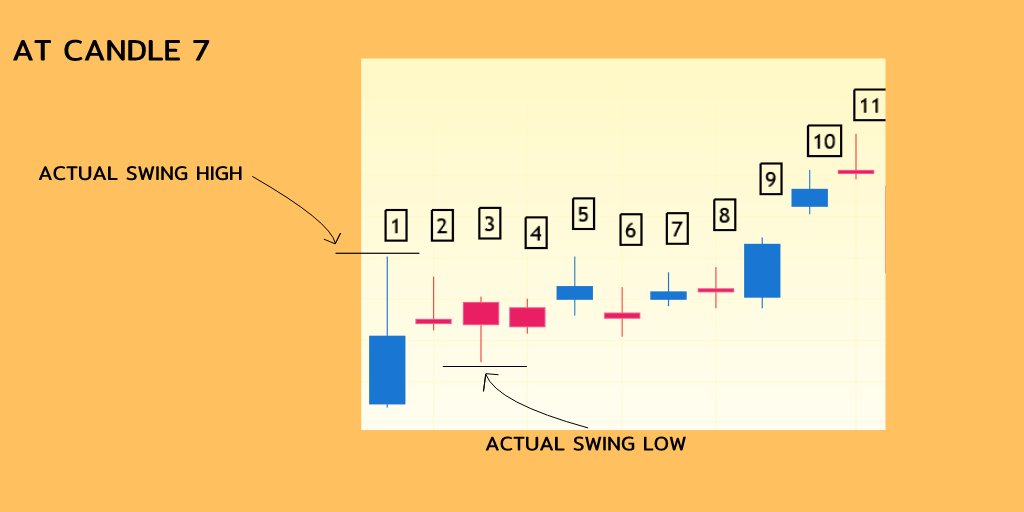
Lets take an example-
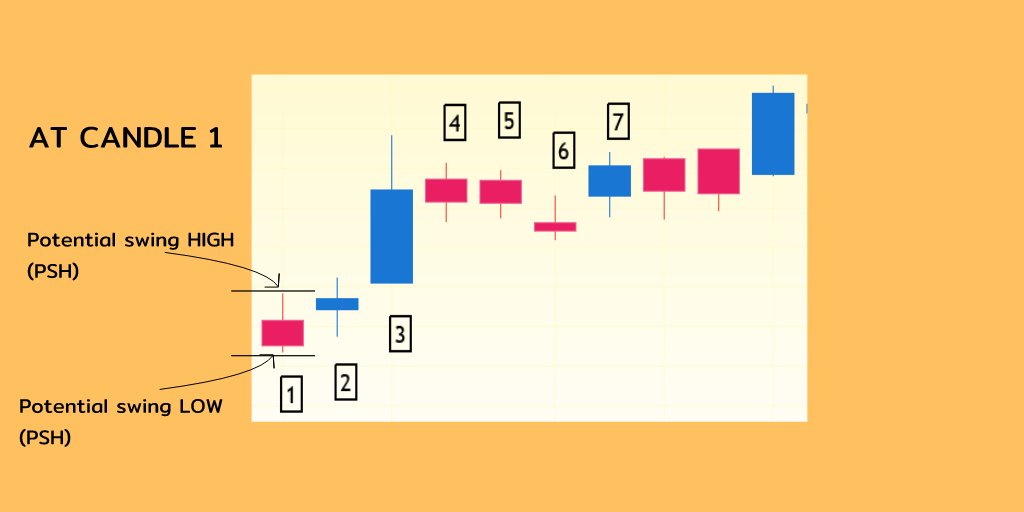
Lets say 1 was the bar from where you start to see your chart,
The high of that candle will be potential swing high, and the low
Of that candle will be potential swing low.
Because the candle 2 broke the 1st candle high, the Potential swing low will still be of candle 1, but now the potential swing high will be of candle 2.
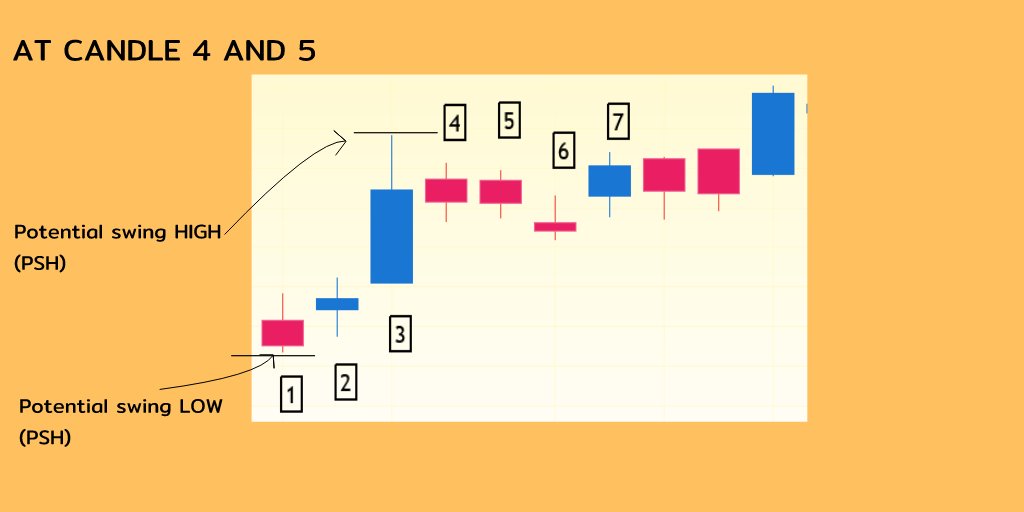
when candle 3 breaks above 2 then potential swing high will be of candle 3 and potential swing low is still 1 as it is not broken till now.
The 4th and 5th candle neither broke above or below the 3 candle high, so no changes in potential swing high ,low points.
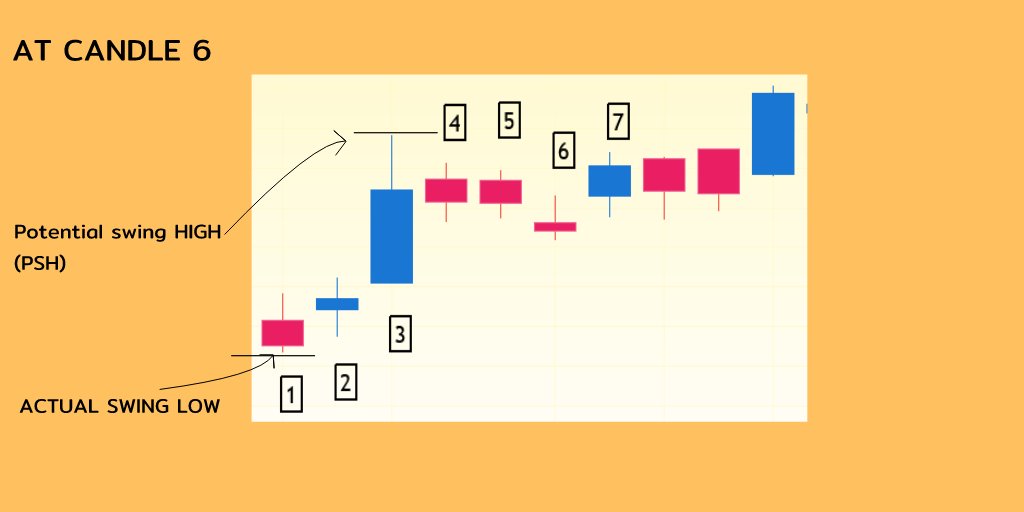
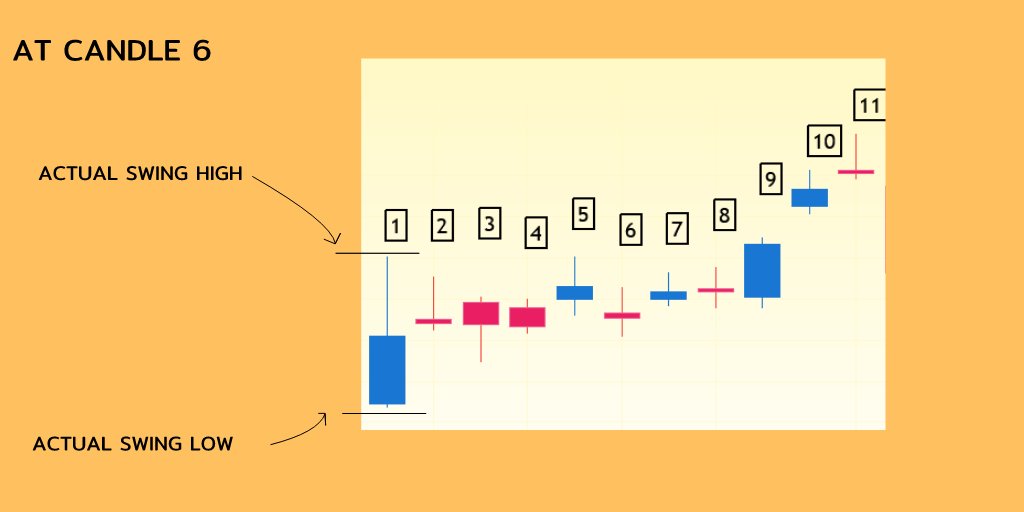
At candle 6 the potential swing point of candle 1 will become actual swing point low, because it is not broken after 5 candle closes, now we can use it as a swing point, in as system.
And candle 6 will be a new potential swing low candle as it has broken the 5 candle.
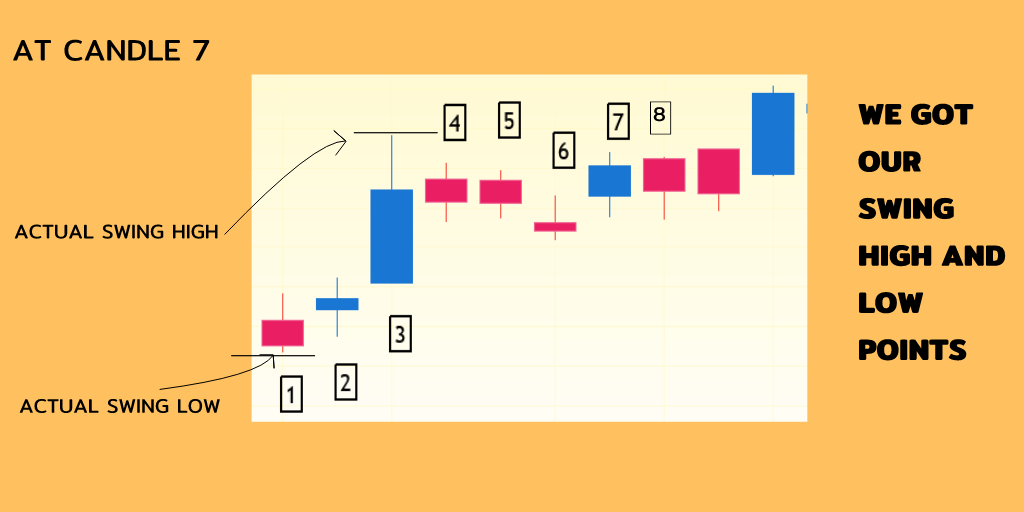
At candle 8 we get the actual swing high as its not broken after 5 candles closings.
this is the process of getting swing points.
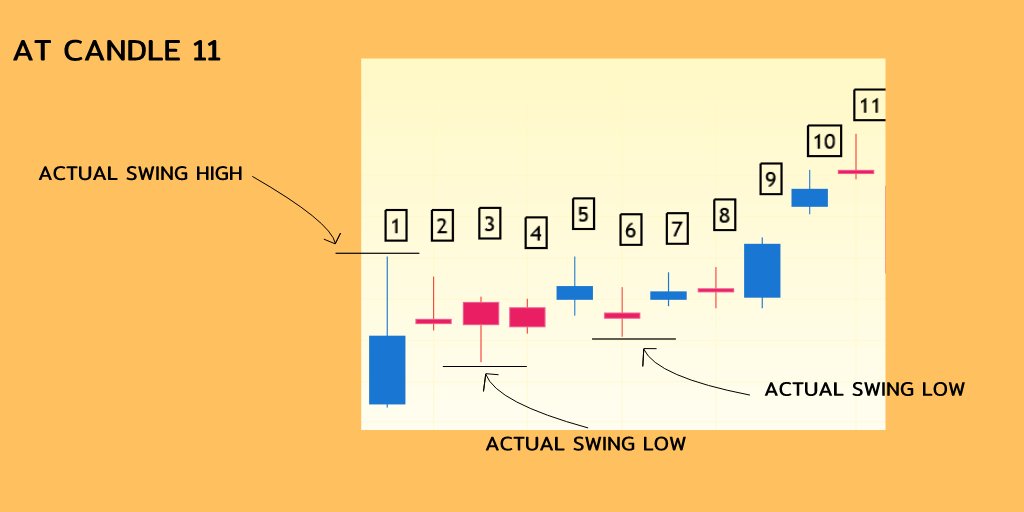
Now, As I said some swing points are not visible to naked eyes as they are not deep swing points.
Another Example-
At candle 6, we get actual swing high and low as its not broken for 5 candles.
at candle 11, we get another actual swing low of candles 6 as its not broken for 5 straight candles.
So this was the first way to know the trend, when the Price breaks above the Swing high for two time we call it an uptrend.
Though many traders also use volume to define the strength of a trend , we will cover that some other day.
2.The second method was to get the trend from moving averages-
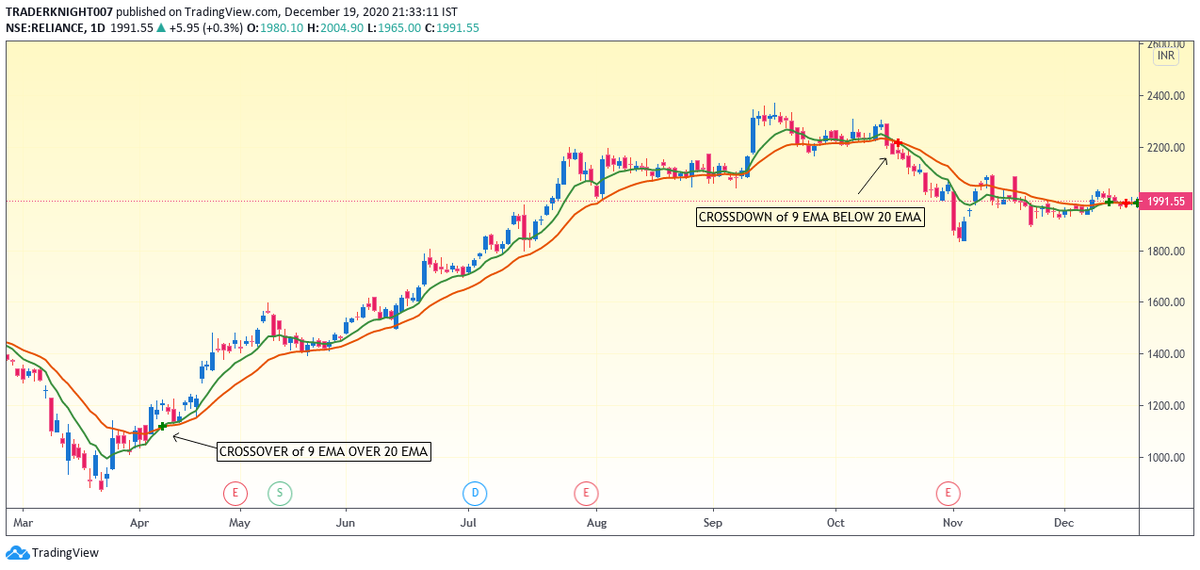
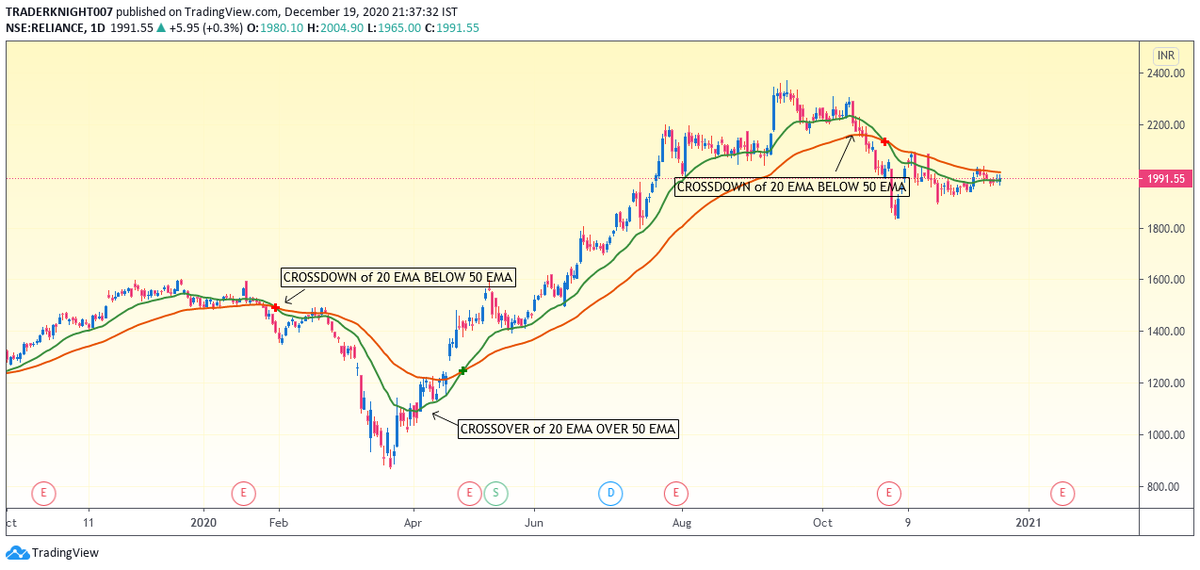
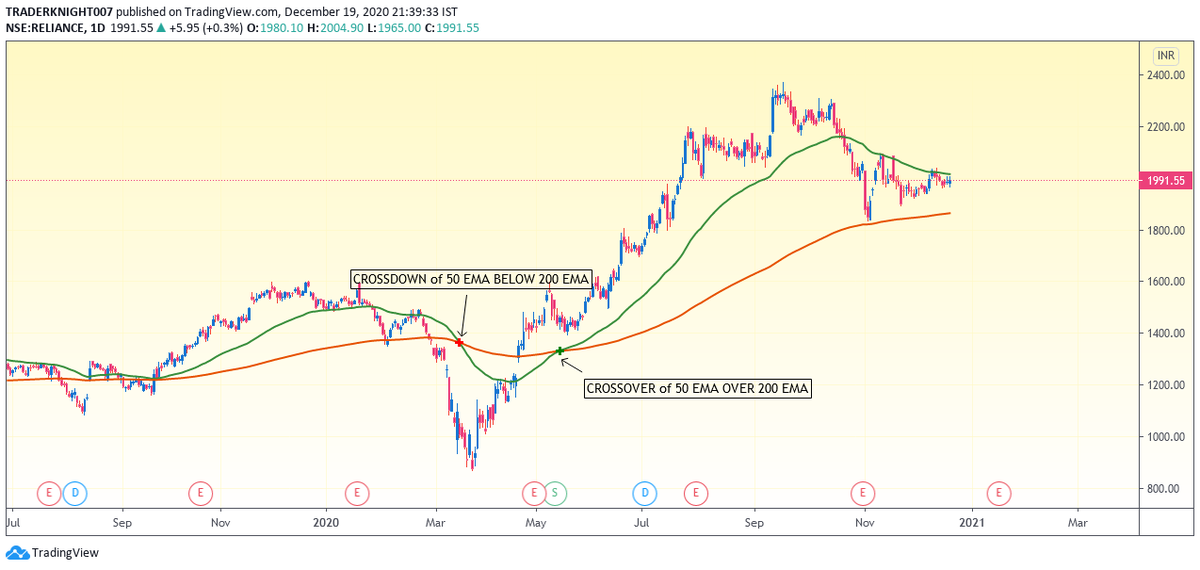
We will use 9,20,50,200 EMA's
Short term trend - 9,20
Medium term trend - 20,50
Long term trend - 50,200
1. In this we used 9, 20 EMA , whe 9 ema cross above 20 ema we consider as an uptrend for short term
2. EMA, 20 AND 50 for medium term trend identification.
3. EMA 50, 200 for long term trend .
3. Trendlines , this will need some explaination so will cover this in some other thread.
Thanks for reading till here,
Cheers,
TRADERKNIGHT