https://t.co/YXvnzxegSC
A Master thread on @Singh7575 Sir's Long Only Setups with examples on Charts!
This setup is a gift to anyone who trades long ideas and those who want to trade in CASH due to Capital Constraint. Fits best for people who don't do FNO as this picks some amazing scripts.
https://t.co/YXvnzxegSC
This setup best fits in @tradingview /@zerodhaonline or any broker that provides charting. We only need 2 Indicators.
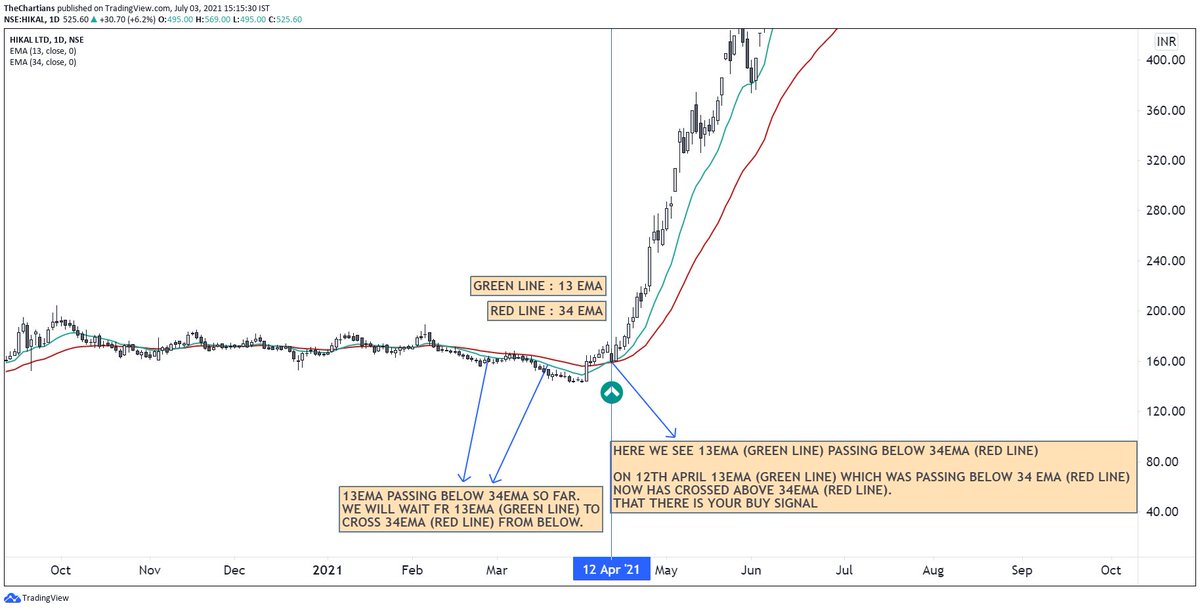
Indicator 1- 13EMA
Indicator 2 - 34EMA
Both indicators are compulsory and should be exponential(EMA) instead of Simple moving average.(SMA)
Whenever this Setup meets a condition where 13EMA crosses 34EMA from below as depicted in the chart. Whenever the 13EMA crosses 34EMA from below it is a LONG (BUY) SIGNAL.
❗️Timeframe needs to be Daily Only!
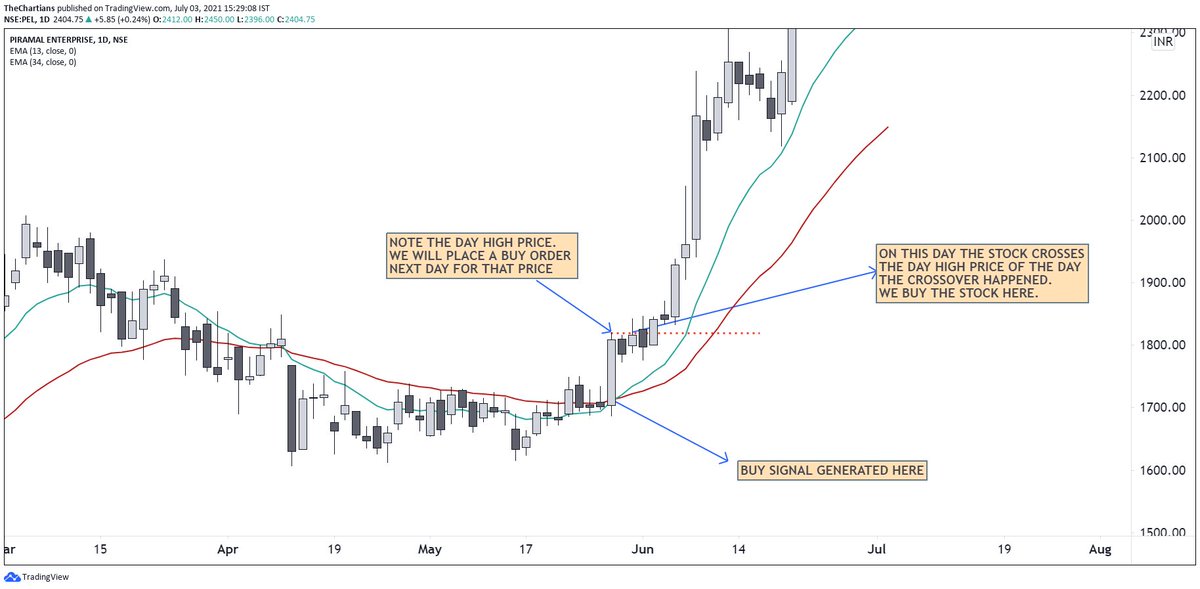
The Condition is to place order above the Day's High when crossover happened. Place buying bid above Previous Day’s high. If on current day the stock
doesn’t cross previous day’s high, place a buying bid the next day above current day’s high. For E.g.
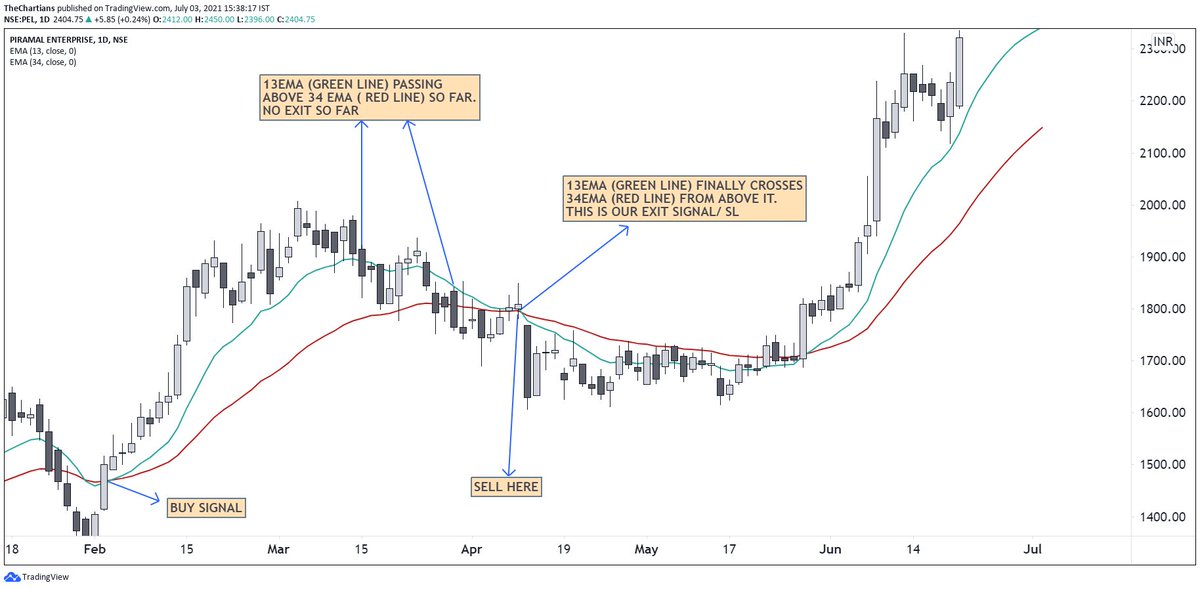
Whenever the 13EMA crosses 34EMA from above it is a signal to EXIT or take your SL. For E.g.
SL is a very subjective but vital part in any trading setup. Some take SL based on certain%, PREVIOUS DAY LOW, WEEK LOW. For our comfort on the system we usually take SL as following.
Entry is near a SWING LOW we take SWING LOW as SL.
Let's see how we did it.


Angad Sir's YouTube Channel.
https://t.co/NyAnucpLjU
More from The Chartians
To be a Successful Trader you need Edge.
And Edge comes with Data and Resources.
But 90% of Retail don’t have access to authentic educational data.
This compilation is surely a 50,000₹ Technical Analysis’s course in itself 🧵
https://t.co/PTeE1Hms9Y
https://t.co/2JvDpSzHds
https://t.co/QuX8o1MUbo
https://t.co/5dBdHq9CBY
And Edge comes with Data and Resources.
But 90% of Retail don’t have access to authentic educational data.
This compilation is surely a 50,000₹ Technical Analysis’s course in itself 🧵
https://t.co/PTeE1Hms9Y
Trading on chart patterns is difficult, Until you see this:
— The Chartians (@chartians) August 6, 2022
Free Technical Analysis course (1/10) \U0001f9f5
https://t.co/2JvDpSzHds
Trading on chart patterns is difficult, Until you read this ! \u26a1\ufe0f
— The Chartians (@chartians) August 21, 2022
Everything about Cup and Handle Pattern
Free Technical Analysis course (2/10) \U0001f9f5
https://t.co/QuX8o1MUbo
Trading on chart patterns is difficult until you read this !\u26a1\ufe0f
— The Chartians (@chartians) August 28, 2022
Everything about Ascending Triangle Pattern
Free Technical Analysis course (3/10) \U0001f9f5
https://t.co/5dBdHq9CBY
Trading on chart patterns is difficult, Until you read this ! \u26a1\ufe0f
— The Chartians (@chartians) October 9, 2022
Everything about Head and Shoulder Pattern
Free Technical Analysis course (4/10) \U0001f9f5


More from Stockslearnings

Pls go to Nifty daily chart, convert candle stick chart to line chart
Make time period Weekly
Then click on the encircled + sign in top panel to add different index to compare, u can add any index
Will describe this in our Friday post market session, watch in SE YouTube channel
Make time period Weekly
Then click on the encircled + sign in top panel to add different index to compare, u can add any index
Will describe this in our Friday post market session, watch in SE YouTube channel
Sir can u please make a video on how to get this plotted in trading view .Please sir .a small guidance will be highly appreciated .I know there are many like me who don't know to plot it but are shy to admit .it would benefit them too .thank u sir
— rajesh shetty (@shettyrajeshs) May 4, 2021


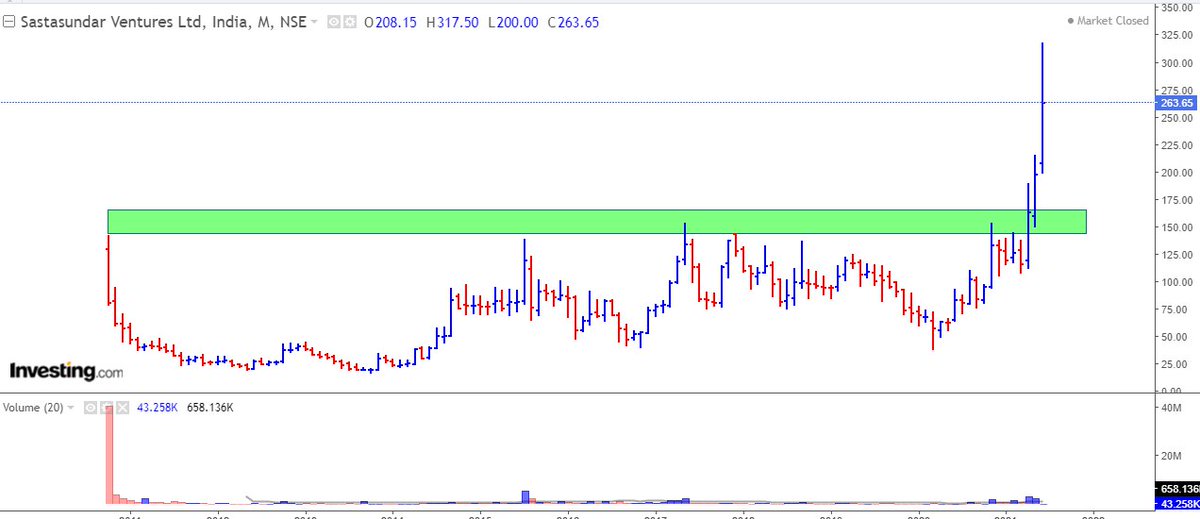
🌟Lesson 1 - weekly /monthly breakout push stock price 30/50% higher in 2/3 weeks.
Ex- #sastasundar after breakout 145/155 zone , stocks in 2/3 weeks given 30/40% return.
And in 2/3 months it was double 💞 https://t.co/9kkc3IV4Lo
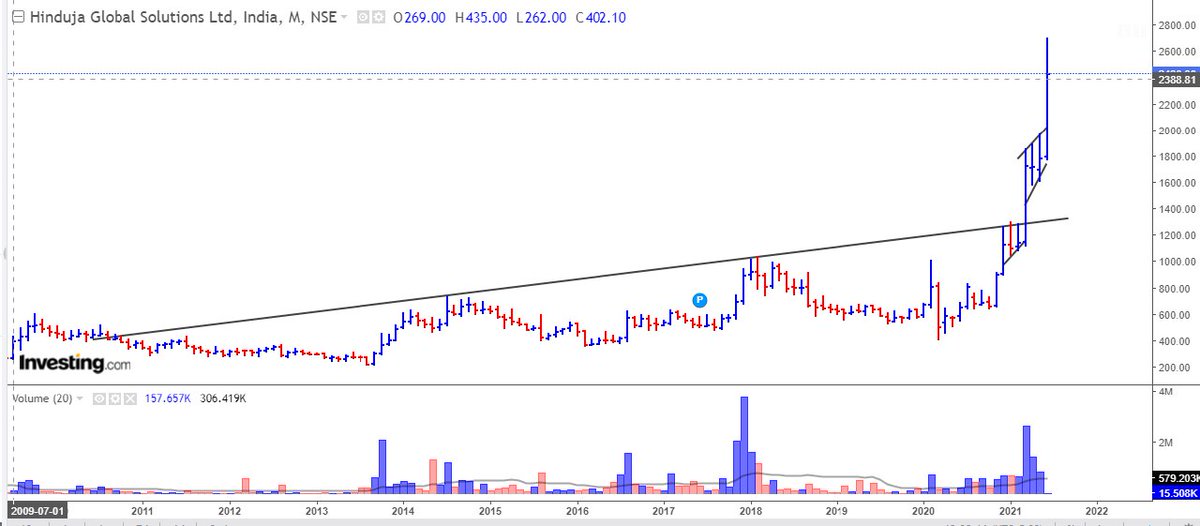
🌟Lesson 2 - if stock is making same pattern ( in 2 /3hours chart) after given breakout of (weekly /monthly chart) , then chances of stock going up is much more.
Ex - #HGS after given breakout of Trendline ( range) in monthly chart, again making same pattern 4 hours chart. 💞
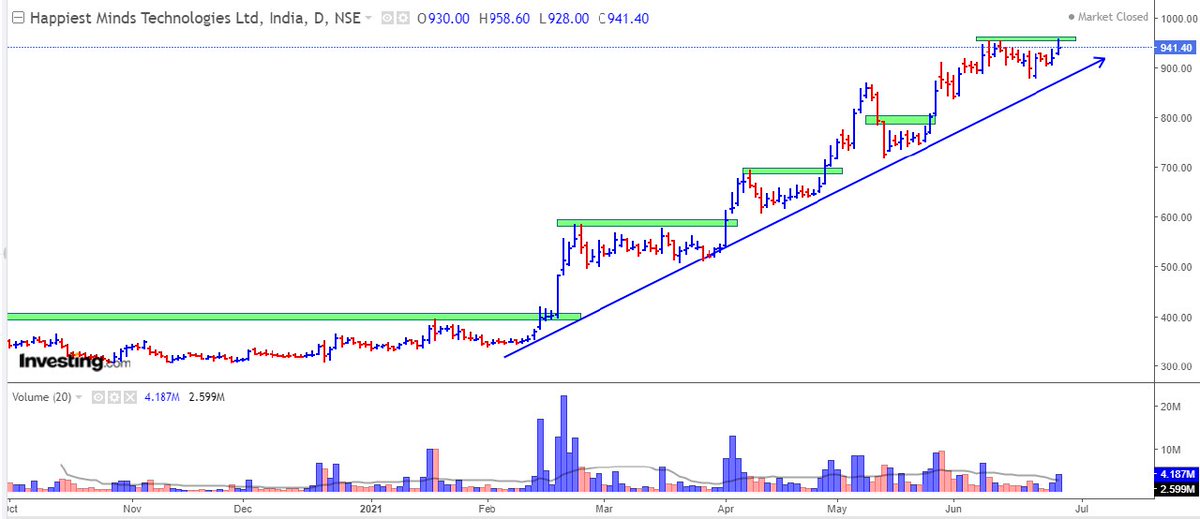
🌟Lesson 3- if stock never come to retest it's weekly & monthly breakout zone then the chances of it's 2x is much more.
EX - #happiestmind everytime consolidating & making new high. 💞
@chartmojo
@charts_breakout

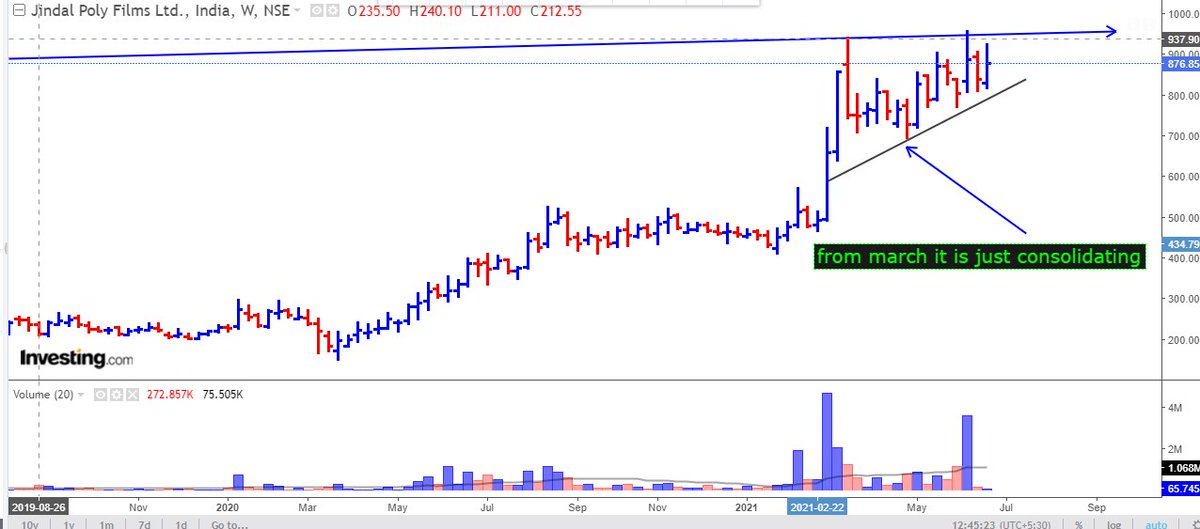
🌟Lesson 4 - when whole market fall still strongest stocks only consolidate or move down very little.
Ex - when this march market took correction 800/1000 points #jindalpoly just consolidating from that time.
Now ready for new high . 💞
🌟Lesson 5 - when market recover the strongest stocks recover very fast & will make new high.
Ex - #happiestmind when market take little correction & again bounce little , then #happiestmind made new high before market .
Ex- #sastasundar after breakout 145/155 zone , stocks in 2/3 weeks given 30/40% return.
And in 2/3 months it was double 💞 https://t.co/9kkc3IV4Lo
I am going to make #priceaction breakout thread with real examples
— V\xb6k\u03c0nT (@Trading0secrets) June 24, 2021
By which u can easily find out blasting stocks.
it is only based on my experience of last 5 years
How many learners are excited \U0001f973
Show your love \u2764 by likes & retweets so that most new one can take advantage.
🌟Lesson 2 - if stock is making same pattern ( in 2 /3hours chart) after given breakout of (weekly /monthly chart) , then chances of stock going up is much more.
Ex - #HGS after given breakout of Trendline ( range) in monthly chart, again making same pattern 4 hours chart. 💞
🌟Lesson 3- if stock never come to retest it's weekly & monthly breakout zone then the chances of it's 2x is much more.
EX - #happiestmind everytime consolidating & making new high. 💞
@chartmojo
@charts_breakout
🌟Lesson 4 - when whole market fall still strongest stocks only consolidate or move down very little.
Ex - when this march market took correction 800/1000 points #jindalpoly just consolidating from that time.
Now ready for new high . 💞
🌟Lesson 5 - when market recover the strongest stocks recover very fast & will make new high.
Ex - #happiestmind when market take little correction & again bounce little , then #happiestmind made new high before market .

This is so useful. Thank you @heartwon 🙏
On this auspicious day of #GuruPoornima2020
— \u03b1\u043c\u03b9\u0442\u0442 \u0455\u03b1\u03b9\u03b7\u03b9 \U0001f1ee\U0001f1f3 (@heartwon) July 5, 2020
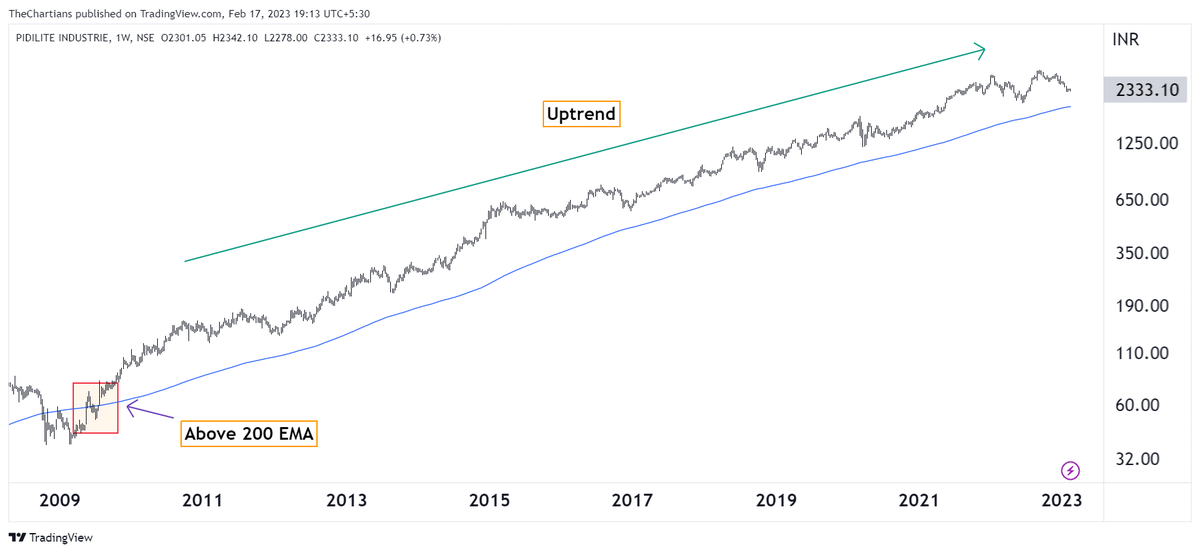
Would like to present a simple yet effective way of understanding and following the TREND of the instrument/stock.
Q: Why I came up with the concept?
A: I wanted to remove noise, keep my chart simple where just a glance, tells the story