5 things that a trader should know and implement:
Google sheets is used by almost 99% people in the world 🌎
Most people don’t know how to use it for TRADING and INVESTING purposes 📖
10 features everyone should know :
5 things that a trader should know and implement:
Above function is a basic one.
Let's decode each parameter in this:
1. Ticker: This is the symbol of the stock.
"NSE: RELIANCE" is the ticker for Reliance Industries

The attribute to fetch about ticker from Google Finance and is required if a date is specified.
Following data can be fetched:
-Open
-Close
-High
-Low
-Volume
-Market Cap
-Price (Ltp)
-52-week high
-52-week low
-Change in price
4. End_Date|Num_Days (O): The end date when fetching historical data, or the number of days from start_date for which to return data.
5. Interval (O): The frequency of returned data; either "D" or "W"
GOOGLEFINANCE("NSE:TCS","PRICE")
This function will help you in fetching stock price live.
Make sure you mention exchange and ticker code properly.
Attribute can be price or any of the above attribute.

=GOOGLEFINANCE("TCS","PRICE", "01/02/2022")
This function will fetch the TCS stock price as on 1st Feb 2022.
Output is shown in the image below image.

=GOOGLEFINANCE("NSE:TCS","price","01/01/2022","15/01/2022")
This will fetch Trent Daily Stock Price from 1st June to 15th June 2022.
Output is shown in the image below image.

=GOOGLEFINANCE("NSE:Tcs","price","01/10/2021","15/01/2022", "Weekly")
This will fetch Trent Weekly Stock Price from 1st Oct to 15th Jan 2022.
Output is shown in the image below image.

Some basic function which you can use are:
1. "Today()" = Fetch Current Date.
2. "Today()-30" = Fetch 30 days back date.
3. EDATE("01/02/2022",-3) = Fetch 3 months back date.
➡️Track all your open and close position just like how we are doing this for years.
➡️If you monitor your closed position, then you can create a graph of your capital and NAV/Equity Curve easily.

In the image, we are fetching the last 7 years' data of TCS stock price in just a few seconds, otherwise it would have taken hours.
Above data, you can use to do backtesting of any strategy.

https://t.co/xEg2LWQ7hC
Google sheets is used by almost 99% people in the world \U0001f30e
— The Chartians (@chartians) August 9, 2022
Most people don\u2019t know how to use it for TRADING and INVESTING purposes \U0001f4d6
10 features everyone should know :
CHARTIANS LIFETIME FREE GROUP ANNOUNCEMENT!
— The Chartians (@chartians) August 8, 2022
\u26a1\ufe0f Positional option strategies [ Stock + Index ].
\u26a1\ufe0f Hero zero calls.
\u26a1\ufe0f Our High Probable Cash and Positional picks \U0001f60e
\u26a1\ufe0f Short & long term Swing bets.
\u26a1\ufe0fIndex Option Spreads for Safe players
How to Join |https://t.co/pUjh0jw1Kk pic.twitter.com/5koT8A2lEi
More from The Chartians
Here are the compilation of free educational contents we shared till now.
Kindly RETWEET and LIKE if you feel our efforts adding to your knowledge.

🩸Types of
🩸 Detailed guide on TX, a free trading tool by
🩸 Fibonacci retracement and golder ratio - Part
🩸 Fibonacci retracement and golden ratio - Part
Kindly RETWEET and LIKE if you feel our efforts adding to your knowledge.
🩸Types of
There are 4\u20e3 type of #BREAKOUTS
— The Chartians (@chartians) January 22, 2021
1\u20e3 Breakout with no retest
2\u20e3 Breakout with a re-test
3\u20e3 Breakout with a hard re-test
4\u20e3 Failed breakout.
We Will Explain it one by one with examples. Kindly Retweet it if you find it useful. #Nifty
🩸 Detailed guide on TX, a free trading tool by
A detailed guide on #TX3 by @EdelweissFin
— The Chartians (@chartians) August 8, 2021
Software worth 50,000/- for F R E E \U0001f3c6
Scroll down \U0001f447 for detailed analysis
(Using for 2+years)
User guide PDF \U0001f4d9 https://t.co/Ke7Bn2jRO8 #chartians #momentum #StockMarketindia #trading #tx3 #edelweiss pic.twitter.com/6M7TCYpPLc
🩸 Fibonacci retracement and golder ratio - Part
\U0001fa78FIBONACCI retracement and GOLDEN RATIO - PART 2
— The Chartians (@chartians) August 8, 2021
Before we move forward, kindly like and retweet if you find our content is adding something to your knowledge. pic.twitter.com/HDlcOa5ZPP
🩸 Fibonacci retracement and golden ratio - Part
\U0001fa78FIBONACCI retracement and GOLDEN RATIO
— The Chartians (@chartians) August 7, 2021
Before we move forward, kindly like and retweet if you find our content is adding something to your knowledge. pic.twitter.com/iVC6W3pqks


More from All


MASTER THREAD on Short Strangles.
Curated the best tweets from the best traders who are exceptional at managing strangles.
• Positional Strangles
• Intraday Strangles
• Position Sizing
• How to do Adjustments
• Plenty of Examples
• When to avoid
• Exit Criteria
How to sell Strangles in weekly expiry as explained by boss himself. @Mitesh_Engr
• When to sell
• How to do Adjustments
• Exit
Beautiful explanation on positional option selling by @Mitesh_Engr
Sir on how to sell low premium strangles yourself without paying anyone. This is a free mini course in
1st Live example of managing a strangle by Mitesh Sir. @Mitesh_Engr
• Sold Strangles 20% cap used
• Added 20% cap more when in profit
• Booked profitable leg and rolled up
• Kept rolling up profitable leg
• Booked loss in calls
• Sold only
2nd example by @Mitesh_Engr Sir on converting a directional trade into strangles. Option Sellers can use this for consistent profit.
• Identified a reversal and sold puts
• Puts decayed a lot
• When achieved 2% profit through puts then sold
Curated the best tweets from the best traders who are exceptional at managing strangles.
• Positional Strangles
• Intraday Strangles
• Position Sizing
• How to do Adjustments
• Plenty of Examples
• When to avoid
• Exit Criteria
How to sell Strangles in weekly expiry as explained by boss himself. @Mitesh_Engr
• When to sell
• How to do Adjustments
• Exit
1. Let's start option selling learning.
— Mitesh Patel (@Mitesh_Engr) February 10, 2019
Strangle selling. ( I am doing mostly in weekly Bank Nifty)
When to sell? When VIX is below 15
Assume spot is at 27500
Sell 27100 PE & 27900 CE
say premium for both 50-50
If bank nifty will move in narrow range u will get profit from both.
Beautiful explanation on positional option selling by @Mitesh_Engr
Sir on how to sell low premium strangles yourself without paying anyone. This is a free mini course in
Few are selling 20-25 Rs positional option selling course.
— Mitesh Patel (@Mitesh_Engr) November 3, 2019
Nothing big deal in that.
For selling weekly option just identify last week low and high.
Now from that low and high keep 1-1.5% distance from strike.
And sell option on both side.
1/n
1st Live example of managing a strangle by Mitesh Sir. @Mitesh_Engr
• Sold Strangles 20% cap used
• Added 20% cap more when in profit
• Booked profitable leg and rolled up
• Kept rolling up profitable leg
• Booked loss in calls
• Sold only
Sold 29200 put and 30500 call
— Mitesh Patel (@Mitesh_Engr) April 12, 2019
Used 20% capital@44 each
2nd example by @Mitesh_Engr Sir on converting a directional trade into strangles. Option Sellers can use this for consistent profit.
• Identified a reversal and sold puts
• Puts decayed a lot
• When achieved 2% profit through puts then sold
Already giving more than 2% return in a week. Now I will prefer to sell 32500 call at 74 to make it strangle in equal ratio.
— Mitesh Patel (@Mitesh_Engr) February 7, 2020
To all. This is free learning for you. How to play option to make consistent return.
Stay tuned and learn it here free of cost. https://t.co/7J7LC86oW0


You May Also Like

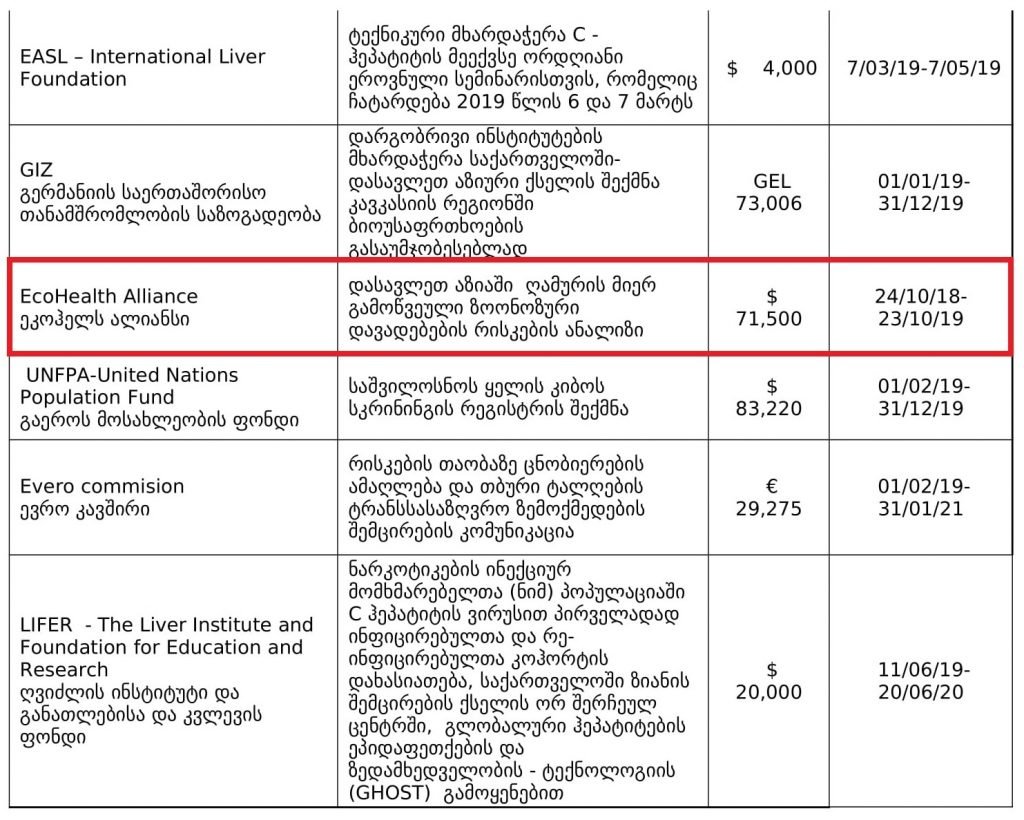
1. Project 1742 (EcoHealth/DTRA)
Risks of bat-borne zoonotic diseases in Western Asia
Duration: 24/10/2018-23 /10/2019
Funding: $71,500
@dgaytandzhieva
https://t.co/680CdD8uug
2. Bat Virus Database
Access to the database is limited only to those scientists participating in our ‘Bats and Coronaviruses’ project
Our intention is to eventually open up this database to the larger scientific community
https://t.co/mPn7b9HM48
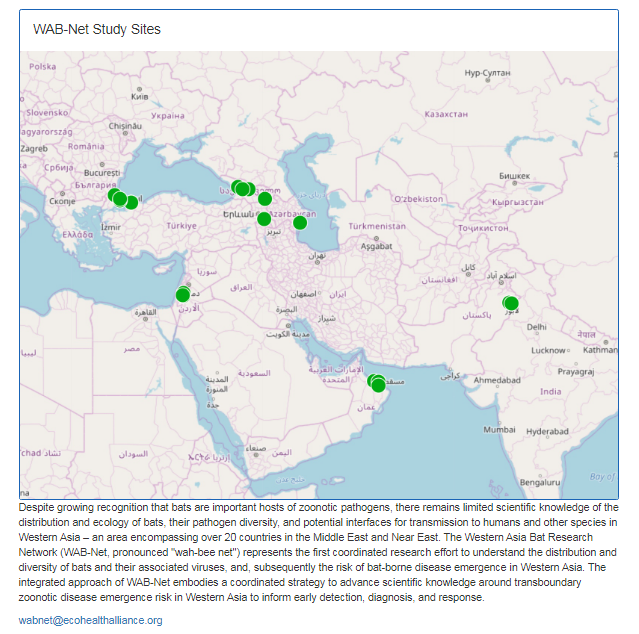
3. EcoHealth Alliance & DTRA Asking for Trouble
One Health research project focused on characterizing bat diversity, bat coronavirus diversity and the risk of bat-borne zoonotic disease emergence in the region.
https://t.co/u6aUeWBGEN
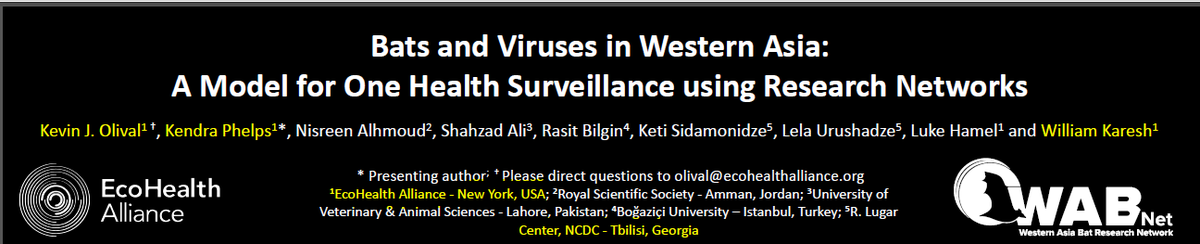
4. Phelps, Olival, Epstein, Karesh - EcoHealth/DTRA
5, Methods and Expected Outcomes
(Unexpected Outcome = New Coronavirus Pandemic)

Risks of bat-borne zoonotic diseases in Western Asia
Duration: 24/10/2018-23 /10/2019
Funding: $71,500
@dgaytandzhieva
https://t.co/680CdD8uug
2. Bat Virus Database
Access to the database is limited only to those scientists participating in our ‘Bats and Coronaviruses’ project
Our intention is to eventually open up this database to the larger scientific community
https://t.co/mPn7b9HM48
3. EcoHealth Alliance & DTRA Asking for Trouble
One Health research project focused on characterizing bat diversity, bat coronavirus diversity and the risk of bat-borne zoonotic disease emergence in the region.
https://t.co/u6aUeWBGEN
4. Phelps, Olival, Epstein, Karesh - EcoHealth/DTRA
5, Methods and Expected Outcomes
(Unexpected Outcome = New Coronavirus Pandemic)