
2/4
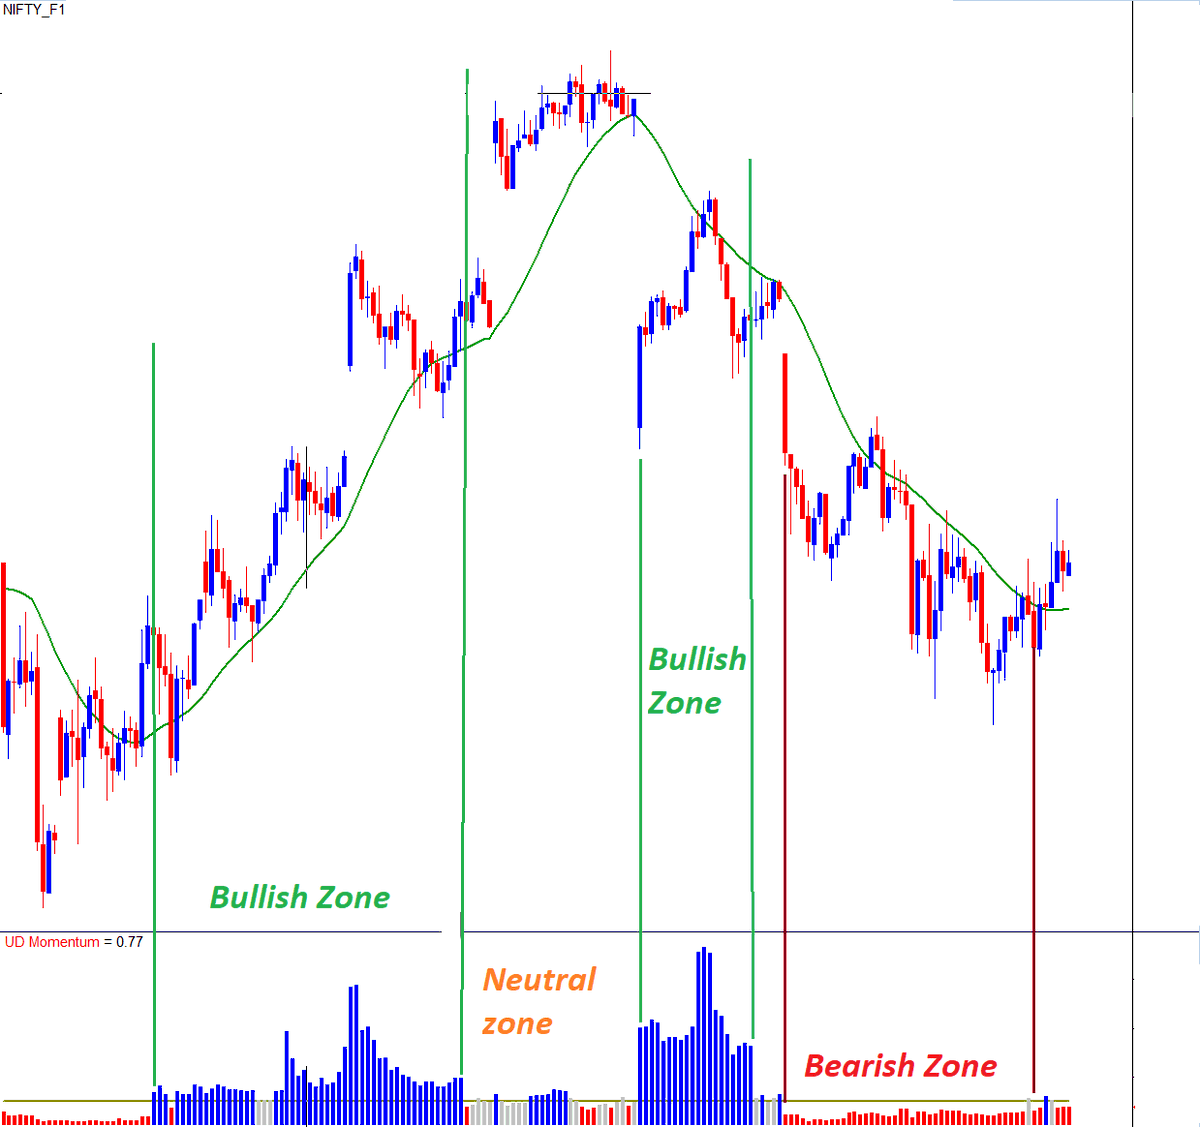
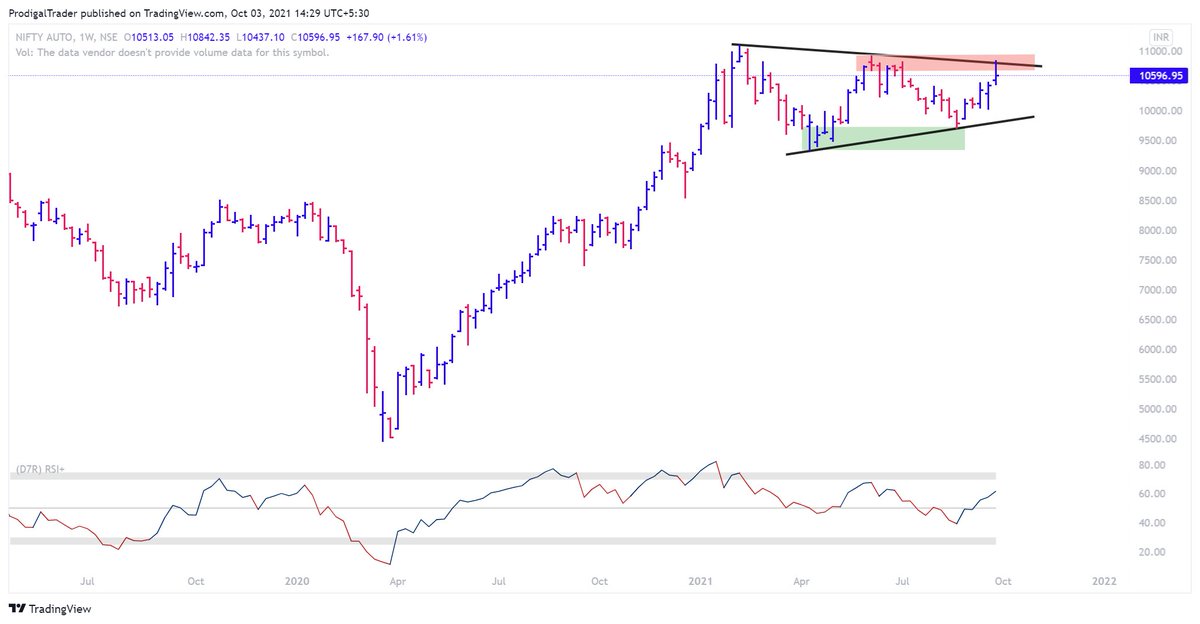
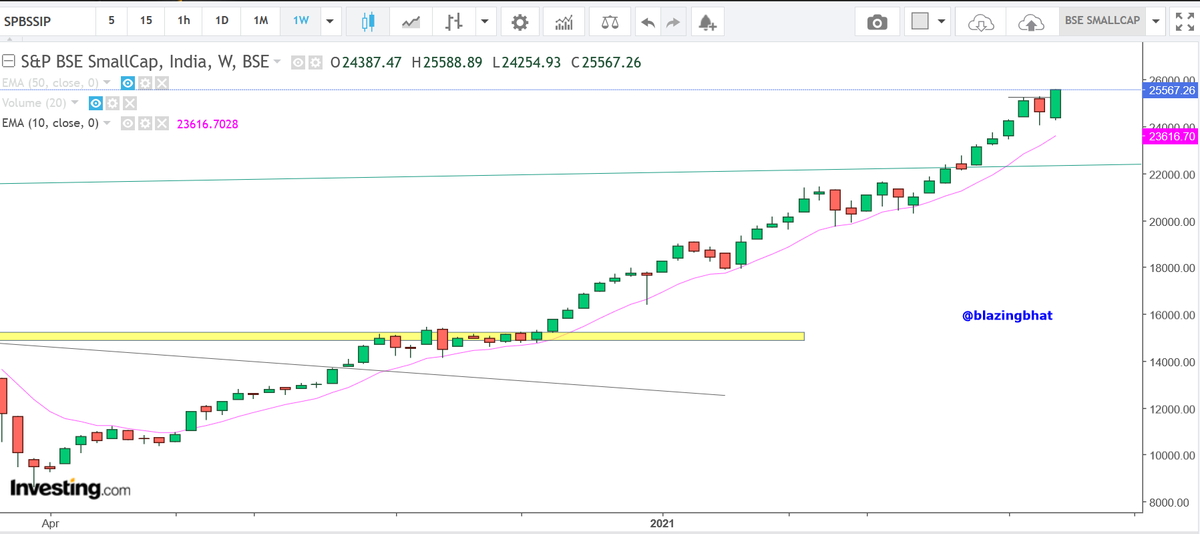
Before making ur trade entry or even before making a bias of trend as either bullish or bearish, do u use any objective measures to define the trend based on price, volume and momentum?
Price will always go back and forth move no matter how strong the trend is.
1/4
2/4
3/4
More from Aneesh Philomina Antony
1.
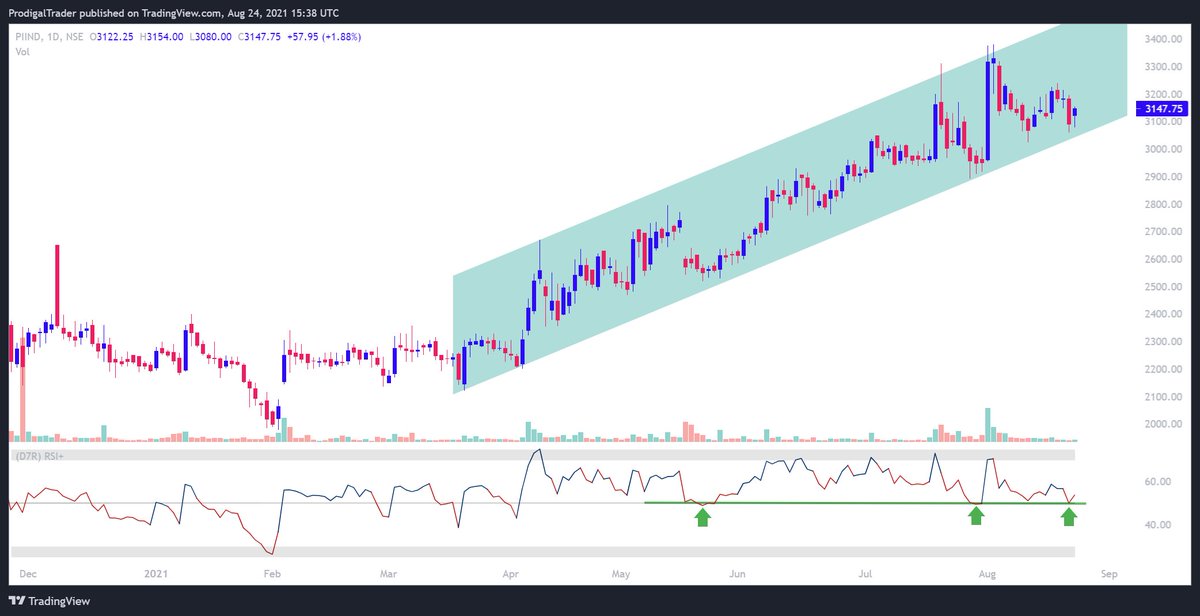
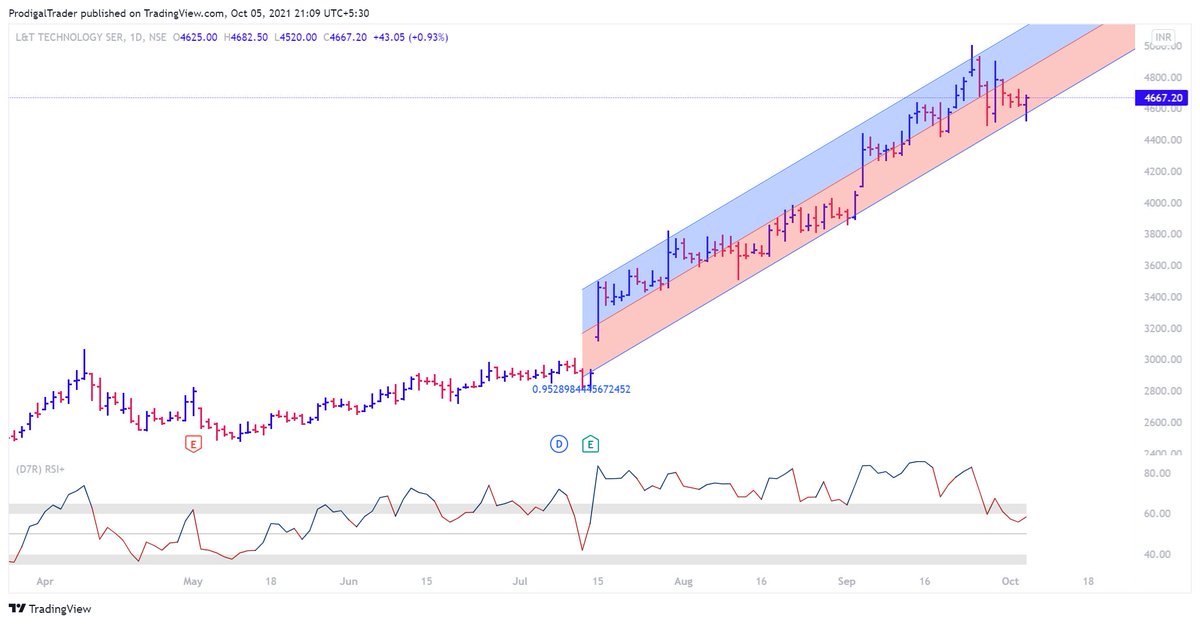
Start fibo retracement from swing high, not the other way around. Simply 0 point should b where retracement started
2.
The base should b chosen as major swing low. Can't just pick a random point
Start fibo retracement from swing high, not the other way around. Simply 0 point should b where retracement started
2.
The base should b chosen as major swing low. Can't just pick a random point
Similar views (shared Yesterday) Aneesh Bhai\U0001f447https://t.co/UxJZFdWJxh
— Bharat Sahni (@NiveshakBharat) September 29, 2021
More from Stockslearnings

🧵Top 20 best tweets of the week: 30th Oct 🧵
Thread's on:
• How to find targets and exit criteria?
• Shanon's Demon (Investing)
• Tradingview scanner- Intraday/BTST
• 90-degree angle inflection point for profit-booking
• Importance of Leverage
Other cool tweets as well.
🧵Shannon's Demon - an investing "thought exercise"
This account writes the best threads, if you like the threads I make, you will surely love this account. Must
🧵Finding expected targets and exit criteria to look for to exit the
🧵Trading View Scanner process to trade in momentum stocks.
🧵90-degree angle inflection point for
Thread's on:
• How to find targets and exit criteria?
• Shanon's Demon (Investing)
• Tradingview scanner- Intraday/BTST
• 90-degree angle inflection point for profit-booking
• Importance of Leverage
Other cool tweets as well.
🧵Shannon's Demon - an investing "thought exercise"
This account writes the best threads, if you like the threads I make, you will surely love this account. Must
1/
— 10-K Diver (@10kdiver) October 23, 2021
Get a cup of coffee.
In this thread, I'll walk you through Shannon's Demon.
This is an investing "thought exercise" -- posed by the great scientist Claude Shannon.
Solving this exercise can teach us a lot about favorable vs unfavorable long-term bets, position sizing, etc.
🧵Finding expected targets and exit criteria to look for to exit the
How to find out the expected targets and what should be the exit criteria when you enter a trade - \U0001f9f5
— Sheetal Rijhwani (@RijhwaniSheetal) October 25, 2021
Possible ways to find out the target:
Check if any patterns forming - it gets quite easy to figure out the targets that way. (1/15)
🧵Trading View Scanner process to trade in momentum stocks.
Trading view scanner process -
— Vikrant (@Trading0secrets) October 23, 2021
1 - open trading view in your browser and select stock scanner in left corner down side .
2 - touch the percentage% gain change ( and u can see higest gainer of today) https://t.co/GGWSZXYMth
🧵90-degree angle inflection point for
The 90 degree angle inflection point in a stock is a signal to book profit
— Nikita Poojary (@niki_poojary) October 24, 2021
Lets understand with a recent example of a stock #IRCTC \U0001f683\U0001f68b
Time for a thread\U0001f9f5




You May Also Like






THE MEANING, SIGNIFICANCE AND HISTORY OF SWASTIK
The Swastik is a geometrical figure and an ancient religious icon. Swastik has been Sanatan Dharma’s symbol of auspiciousness – mangalya since time immemorial.

The name swastika comes from Sanskrit (Devanagari: स्वस्तिक, pronounced: swastik) &denotes “conducive to wellbeing or auspicious”.
The word Swastik has a definite etymological origin in Sanskrit. It is derived from the roots su – meaning “well or auspicious” & as meaning “being”.

"सु अस्ति येन तत स्वस्तिकं"
Swastik is de symbol through which everything auspicios occurs
Scholars believe word’s origin in Vedas,known as Swasti mantra;
"🕉स्वस्ति ना इन्द्रो वृधश्रवाहा
स्वस्ति ना पूषा विश्ववेदाहा
स्वस्तिनास्तरक्ष्यो अरिश्तनेमिही
स्वस्तिनो बृहस्पतिर्दधातु"

It translates to," O famed Indra, redeem us. O Pusha, the beholder of all knowledge, redeem us. Redeem us O Garudji, of limitless speed and O Bruhaspati, redeem us".
SWASTIK’s COSMIC ORIGIN
The Swastika represents the living creation in the whole Cosmos.

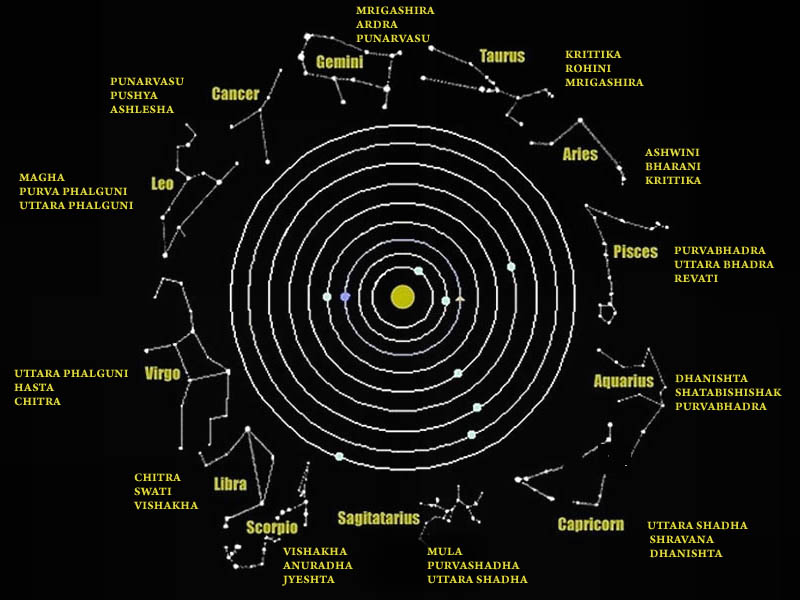
Hindu astronomers divide the ecliptic circle of cosmos in 27 divisions called https://t.co/sLeuV1R2eQ this manner a cross forms in 4 directions in the celestial sky. At centre of this cross is Dhruva(Polestar). In a line from Dhruva, the stars known as Saptarishi can be observed.
The Swastik is a geometrical figure and an ancient religious icon. Swastik has been Sanatan Dharma’s symbol of auspiciousness – mangalya since time immemorial.
The name swastika comes from Sanskrit (Devanagari: स्वस्तिक, pronounced: swastik) &denotes “conducive to wellbeing or auspicious”.
The word Swastik has a definite etymological origin in Sanskrit. It is derived from the roots su – meaning “well or auspicious” & as meaning “being”.
"सु अस्ति येन तत स्वस्तिकं"
Swastik is de symbol through which everything auspicios occurs
Scholars believe word’s origin in Vedas,known as Swasti mantra;
"🕉स्वस्ति ना इन्द्रो वृधश्रवाहा
स्वस्ति ना पूषा विश्ववेदाहा
स्वस्तिनास्तरक्ष्यो अरिश्तनेमिही
स्वस्तिनो बृहस्पतिर्दधातु"
It translates to," O famed Indra, redeem us. O Pusha, the beholder of all knowledge, redeem us. Redeem us O Garudji, of limitless speed and O Bruhaspati, redeem us".
SWASTIK’s COSMIC ORIGIN
The Swastika represents the living creation in the whole Cosmos.
Hindu astronomers divide the ecliptic circle of cosmos in 27 divisions called https://t.co/sLeuV1R2eQ this manner a cross forms in 4 directions in the celestial sky. At centre of this cross is Dhruva(Polestar). In a line from Dhruva, the stars known as Saptarishi can be observed.

So friends here is the thread on the recommended pathway for new entrants in the stock market.
Here I will share what I believe are essentials for anybody who is interested in stock markets and the resources to learn them, its from my experience and by no means exhaustive..
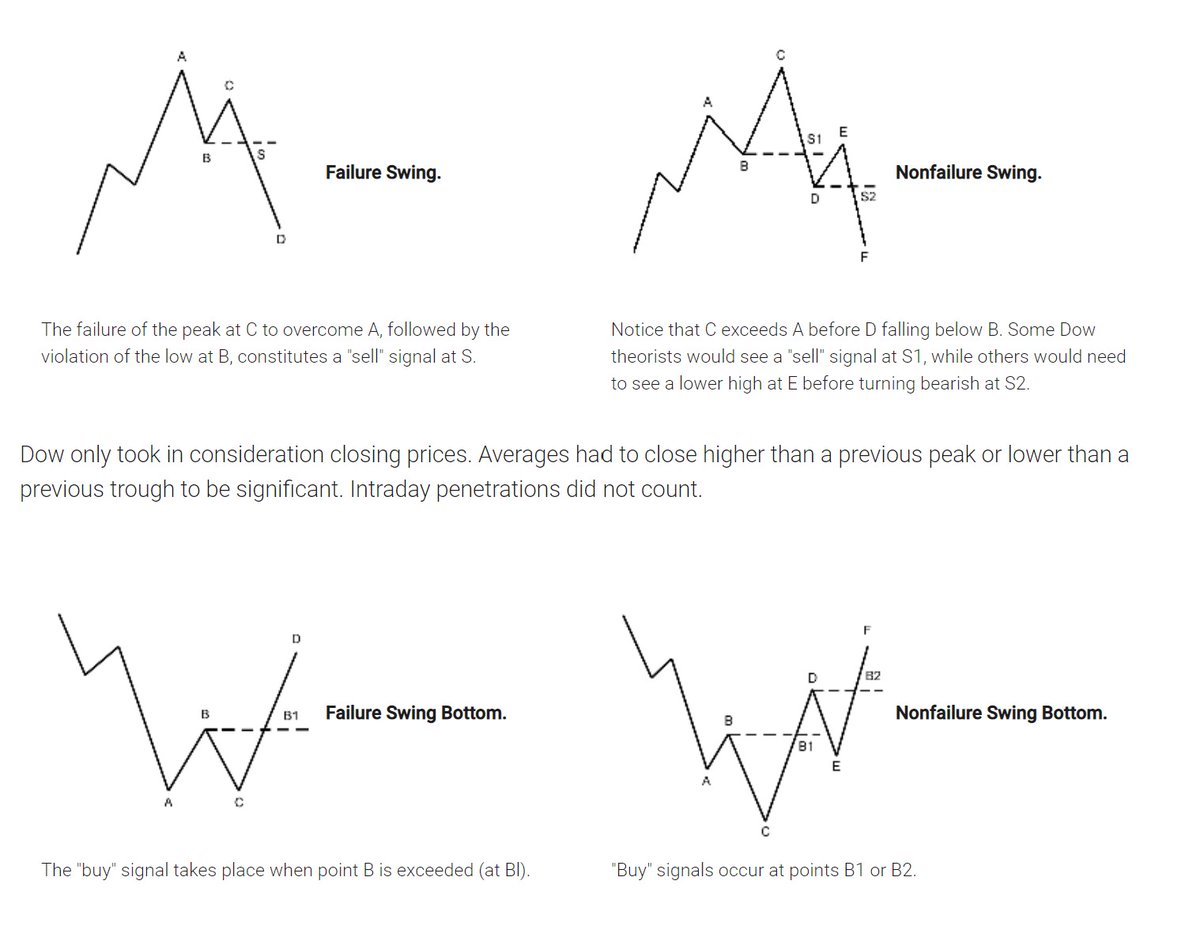
First the very basic : The Dow theory, Everybody must have basic understanding of it and must learn to observe High Highs, Higher Lows, Lower Highs and Lowers lows on charts and their
Even those who are more inclined towards fundamental side can also benefit from Dow theory, as it can hint start & end of Bull/Bear runs thereby indication entry and exits.
Next basic is Wyckoff's Theory. It tells how accumulation and distribution happens with regularity and how the market actually
Dow theory is old but
Here I will share what I believe are essentials for anybody who is interested in stock markets and the resources to learn them, its from my experience and by no means exhaustive..
First the very basic : The Dow theory, Everybody must have basic understanding of it and must learn to observe High Highs, Higher Lows, Lower Highs and Lowers lows on charts and their
Even those who are more inclined towards fundamental side can also benefit from Dow theory, as it can hint start & end of Bull/Bear runs thereby indication entry and exits.
Next basic is Wyckoff's Theory. It tells how accumulation and distribution happens with regularity and how the market actually
Dow theory is old but
Old is Gold....
— Professor (@DillikiBiili) January 23, 2020
this Bharti Airtel chart is a true copy of the Wyckoff Pattern propounded in 1931....... pic.twitter.com/tQ1PNebq7d