
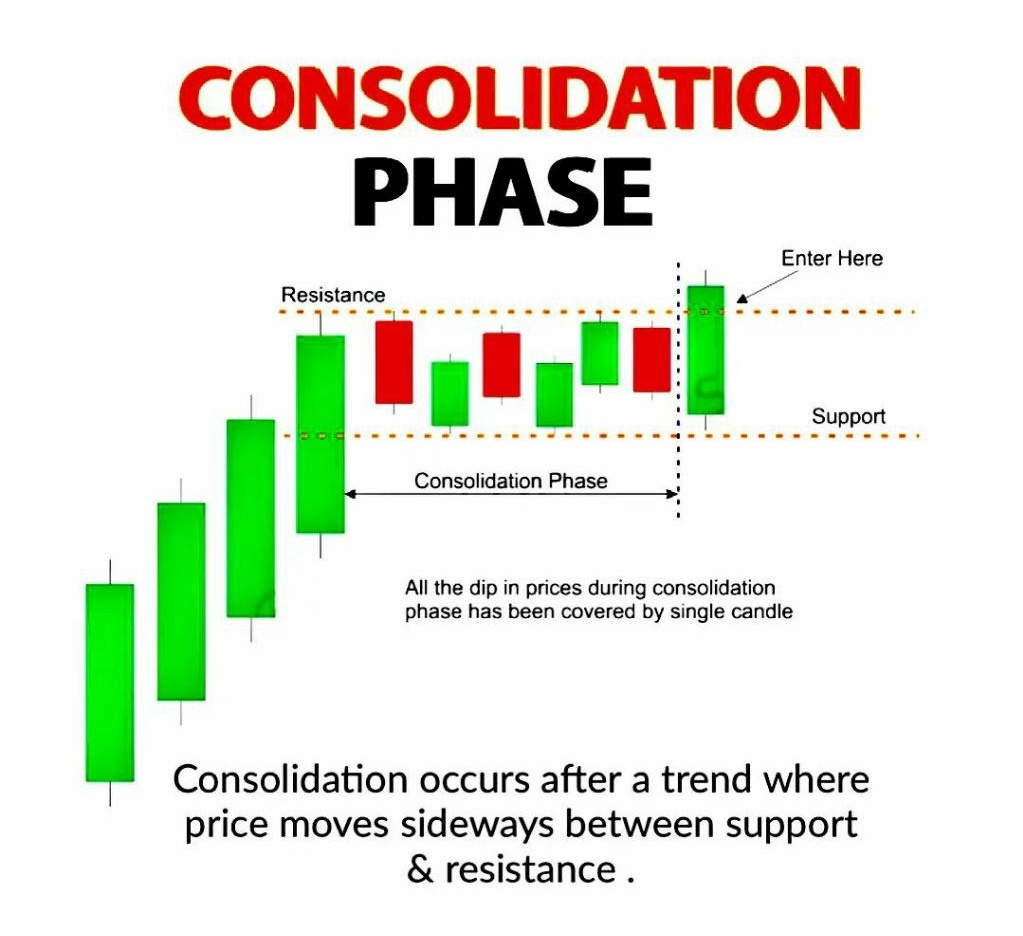
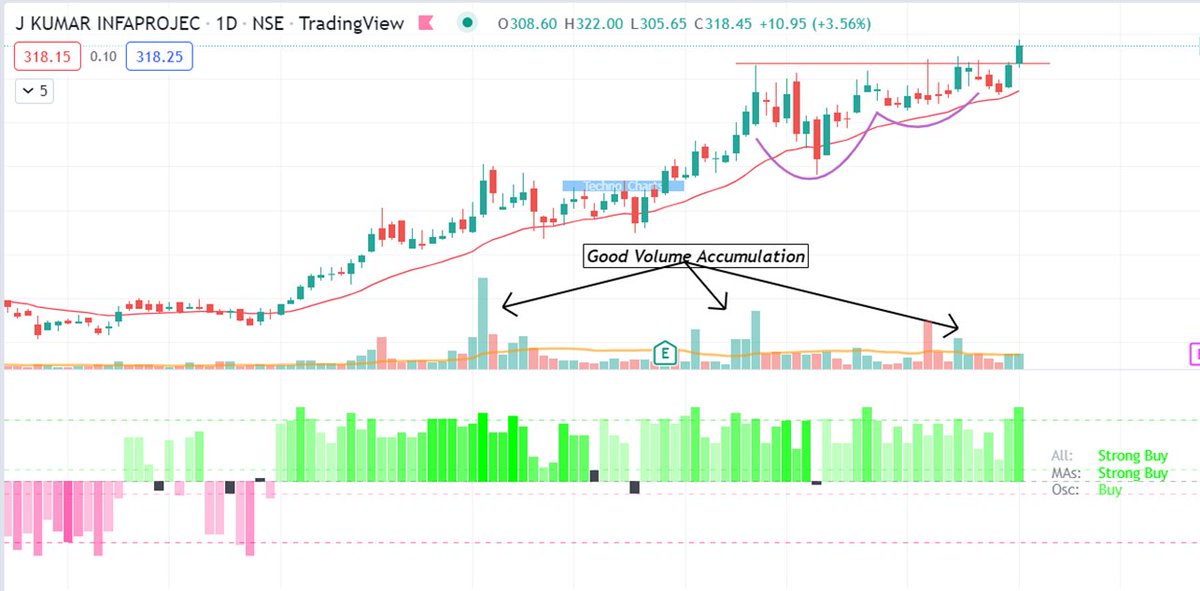
Consolidation Phase Breakout
Look for Dry Volumes in the Base
Volume on Up days > Volume on down days
Greater Consolidation Greater power in Breakout
Look for Continuation Rather than Reversal
Small Bases will Provide Low Risk opportunities
Retweet If you wish for short tips
More from JayneshKasliwal


𝟱 𝗧𝗿𝗮𝗱𝗶𝗻𝗴𝘃𝗶𝗲𝘄 𝗜𝗻𝗱𝗶𝗰𝗮𝘁𝗼𝗿𝘀 𝗮𝗹𝗹 𝗧𝗿𝗮𝗱𝗲𝗿𝘀 𝘀𝗵𝗼𝘂𝗹𝗱 𝗸𝗻𝗼𝘄 𝗮𝗯𝗼𝘂𝘁:
𝗣𝗮𝗿𝘁 𝟮
🧵 Thread 🧵
Retweet And I will Link a 36 Page PDF
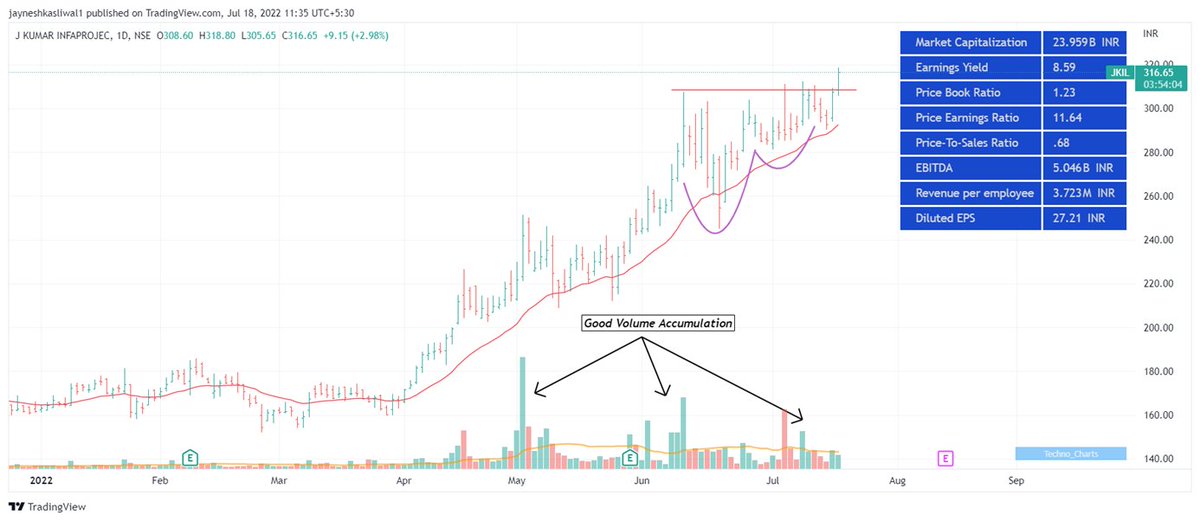
𝟭. 𝗔𝗱𝗱 𝗙𝘂𝗻𝗱𝗮𝗺𝗲𝗻𝘁𝗮𝗹𝘀 𝗼𝗻 𝗰𝗵𝗮𝗿𝘁
🔸 Link:
https://t.co/HcIXT7V002
🔸 Click on the above link -> Add to Favourites -> Add on Chart from favourites and start using it !
2/20
You can add financials from many fundamental criteria's like
🔸 Cashflows
🔸 Income Statements
🔸 Balance sheets
🔸 PE,PB ratios
🔸 Marketcapitlization
🔸 Statistics
3/20
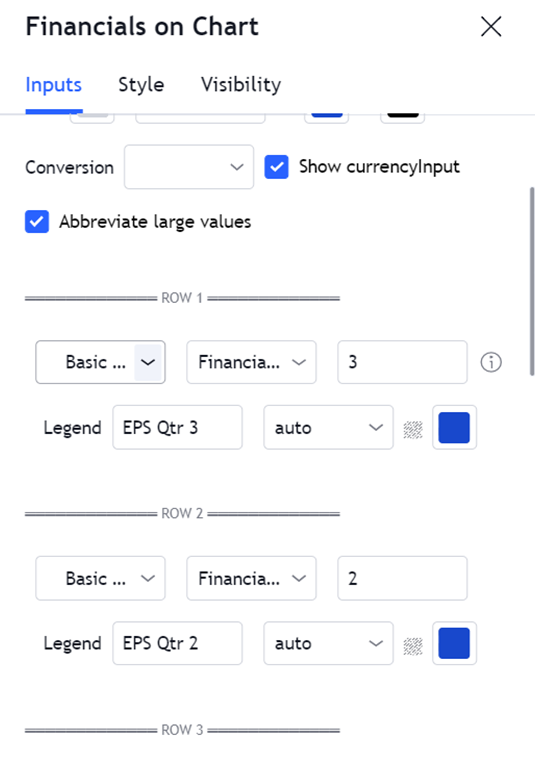
How to change Settings:
🔸 There are 8 columns you can basically select any financial you want
🔸 You can select quarterly or Yearly values and can also write
🔸 The names of the financiaLS Example : EPS Qtr3
🔸 You can Change colours , font size
4/20
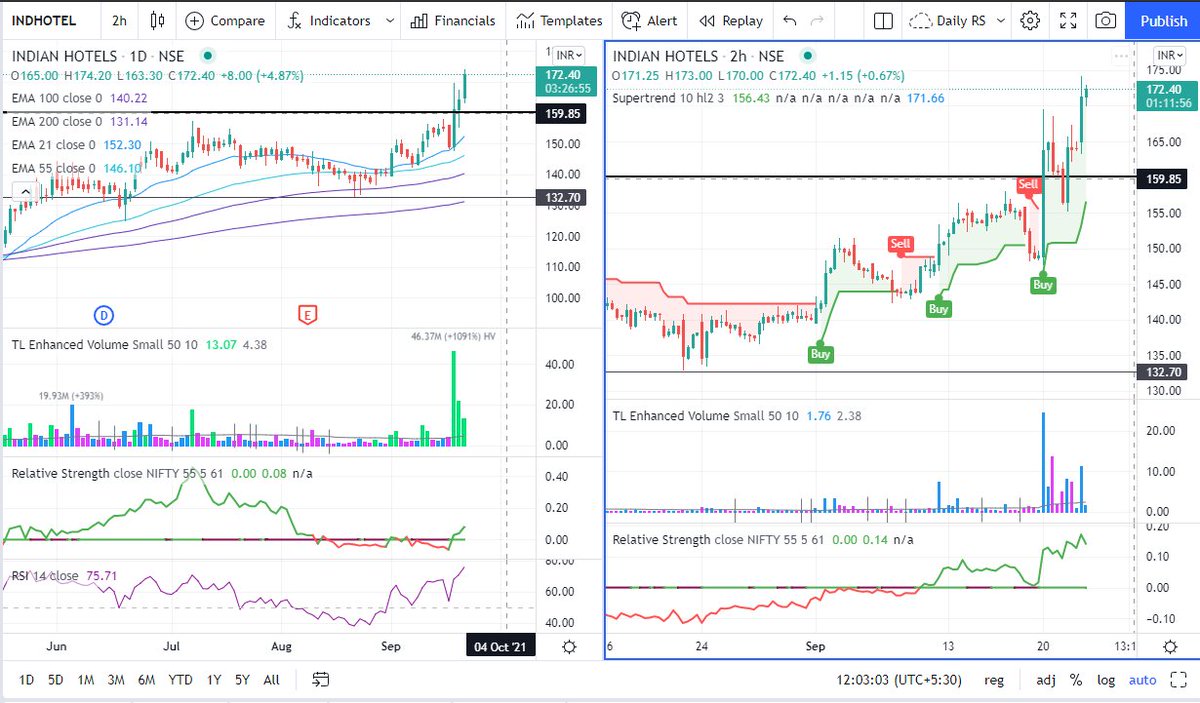
𝟮. 𝗜𝗻𝗱𝗶𝗰𝗮𝘁𝗼𝗿 𝗥𝗮𝘁𝗶𝗻𝗴𝘀
You cannot track each and every indicator like ( 𝗠𝗼𝘃𝗶𝗻𝗴 𝗔𝘃𝗴𝘀 , 𝗥𝗦𝗜 , 𝗠𝗔𝗖𝗗 ) etc , you can use plot this custom strategy to understand whether the trend is positive or negative of those indicators
5/20
𝗣𝗮𝗿𝘁 𝟮
🧵 Thread 🧵
Retweet And I will Link a 36 Page PDF
𝟭. 𝗔𝗱𝗱 𝗙𝘂𝗻𝗱𝗮𝗺𝗲𝗻𝘁𝗮𝗹𝘀 𝗼𝗻 𝗰𝗵𝗮𝗿𝘁
🔸 Link:
https://t.co/HcIXT7V002
🔸 Click on the above link -> Add to Favourites -> Add on Chart from favourites and start using it !
2/20
You can add financials from many fundamental criteria's like
🔸 Cashflows
🔸 Income Statements
🔸 Balance sheets
🔸 PE,PB ratios
🔸 Marketcapitlization
🔸 Statistics
3/20
How to change Settings:
🔸 There are 8 columns you can basically select any financial you want
🔸 You can select quarterly or Yearly values and can also write
🔸 The names of the financiaLS Example : EPS Qtr3
🔸 You can Change colours , font size
4/20
𝟮. 𝗜𝗻𝗱𝗶𝗰𝗮𝘁𝗼𝗿 𝗥𝗮𝘁𝗶𝗻𝗴𝘀
You cannot track each and every indicator like ( 𝗠𝗼𝘃𝗶𝗻𝗴 𝗔𝘃𝗴𝘀 , 𝗥𝗦𝗜 , 𝗠𝗔𝗖𝗗 ) etc , you can use plot this custom strategy to understand whether the trend is positive or negative of those indicators
5/20
More from Screeners


May please read the attached tweet once again for a key LEARNING
USDINR - a breakout that will not bode well for the equities
78+ https://t.co/AWqZxF5B1L
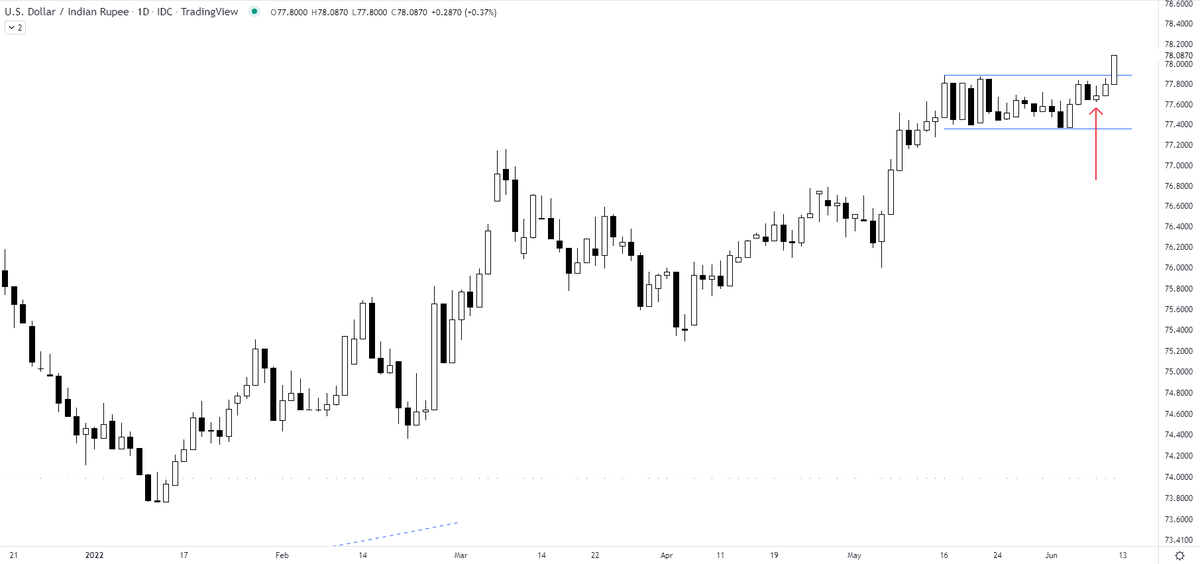
USDINR - a breakout that will not bode well for the equities
78+ https://t.co/AWqZxF5B1L
Can you anticipate a breakout? Yes
— The_Chartist \U0001f4c8 (@charts_zone) June 10, 2022
the attached tweet.
now the chart is for USDINR https://t.co/Vb2wKaCvTB pic.twitter.com/INo0GC4fGY

You May Also Like

#sculpture #story -
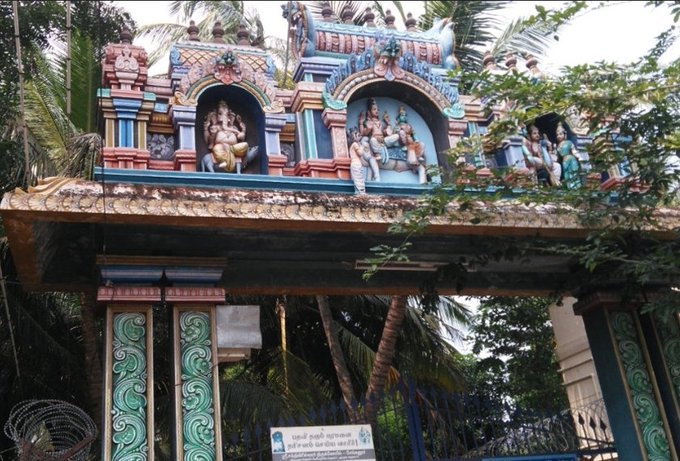
Chandesha-Anugraha Murti - One of the Sculpture in Brihadeshwara Temple at Gangaikonda Cholapuram - built by Raja Rajendra Chola I
This Sculpture depicts Bhagwan Shiva along with Devi Paravathi blessing Chandeshwara - one of the 63 Nayanmars.
#Thread

Chandeshwara/Chandikeshwara is regarded as custodian of Shiva Temple's wealth&most of Shiva temples in South India has separate sannathi for him.
His bhakti for Bhagwan Shiva elevated him as one of foremost among Nayanmars.
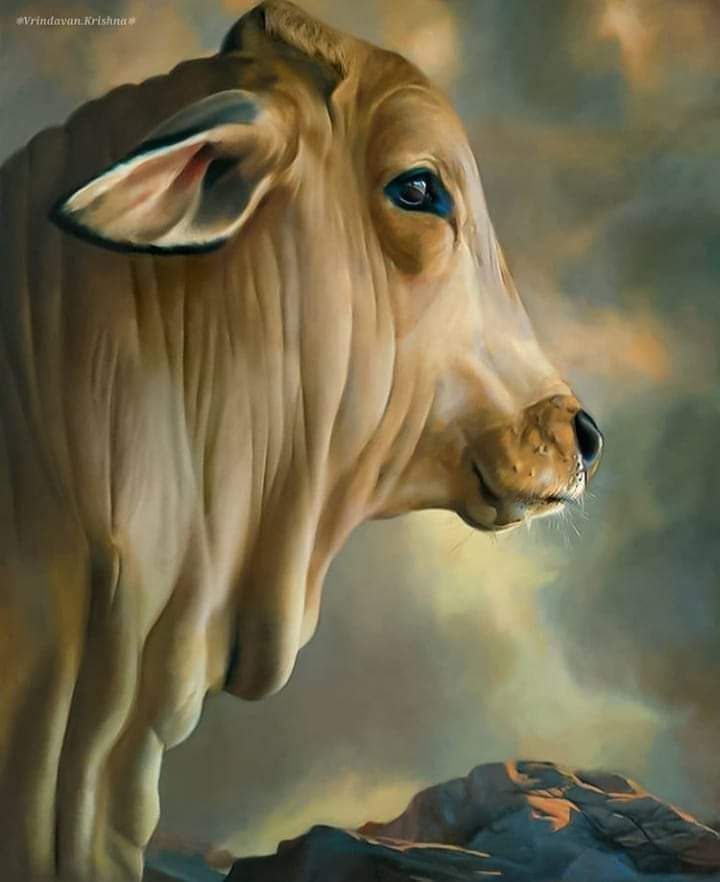
He gave importance to Shiva Pooja&protection of cows.
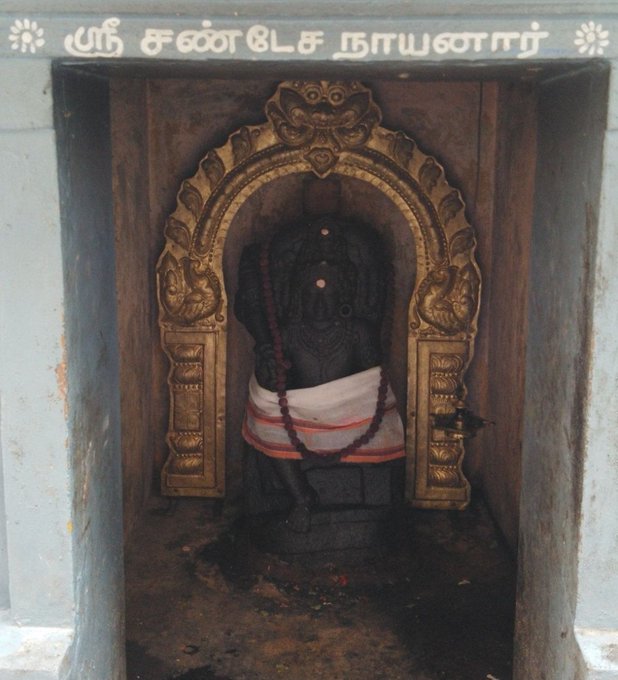
There are series of paintings, illustrating the #story of Chandikeshwar in the premises of
Sri Sathiyagireeswarar #Temple at Seinganur,near Kumbakonam,TN
Chandikeshwara's birth name
is Vichara sarman.He was born in the village of Senganur on the banks of River Manni.
His Parent names were Yajnathatan and Pavithrai.
Vichara Sarman was a gifted child and he learnt Vedas and Agamas at a very young age.
He was very devout and would always think about Bhagwan Shiva.
One day he saw a cowherd man brutally assaulting a cow,Vichara Sarman could not tolerate this. He spoke to cowherd: ‘Do you not know that the cow is worshipful & divine? All gods & Devas reside in https://t.co/ElLcI5ppsK it is our duty to protect cows &we should not to harm them.

Chandesha-Anugraha Murti - One of the Sculpture in Brihadeshwara Temple at Gangaikonda Cholapuram - built by Raja Rajendra Chola I
This Sculpture depicts Bhagwan Shiva along with Devi Paravathi blessing Chandeshwara - one of the 63 Nayanmars.
#Thread
Chandeshwara/Chandikeshwara is regarded as custodian of Shiva Temple's wealth&most of Shiva temples in South India has separate sannathi for him.
His bhakti for Bhagwan Shiva elevated him as one of foremost among Nayanmars.
He gave importance to Shiva Pooja&protection of cows.
There are series of paintings, illustrating the #story of Chandikeshwar in the premises of
Sri Sathiyagireeswarar #Temple at Seinganur,near Kumbakonam,TN
Chandikeshwara's birth name
is Vichara sarman.He was born in the village of Senganur on the banks of River Manni.
His Parent names were Yajnathatan and Pavithrai.
Vichara Sarman was a gifted child and he learnt Vedas and Agamas at a very young age.
He was very devout and would always think about Bhagwan Shiva.
One day he saw a cowherd man brutally assaulting a cow,Vichara Sarman could not tolerate this. He spoke to cowherd: ‘Do you not know that the cow is worshipful & divine? All gods & Devas reside in https://t.co/ElLcI5ppsK it is our duty to protect cows &we should not to harm them.


THREAD: 12 Things Everyone Should Know About IQ
1. IQ is one of the most heritable psychological traits – that is, individual differences in IQ are strongly associated with individual differences in genes (at least in fairly typical modern environments). https://t.co/3XxzW9bxLE
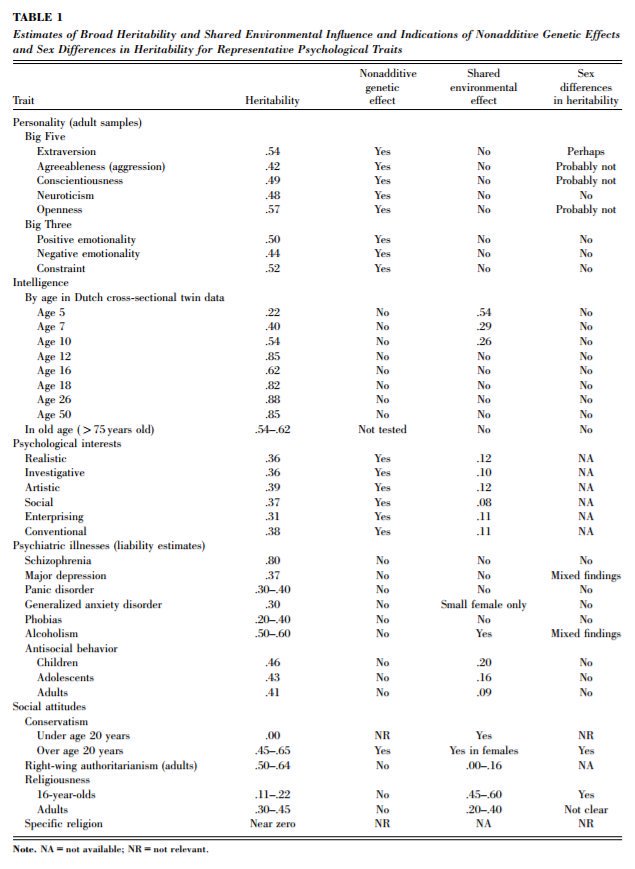
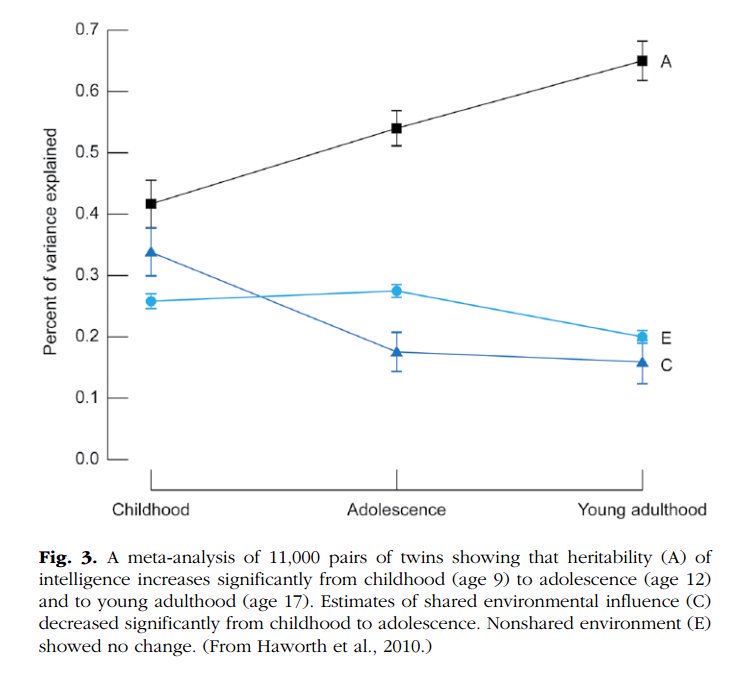
2. The heritability of IQ *increases* from childhood to adulthood. Meanwhile, the effect of the shared environment largely fades away. In other words, when it comes to IQ, nature becomes more important as we get older, nurture less. https://t.co/UqtS1lpw3n
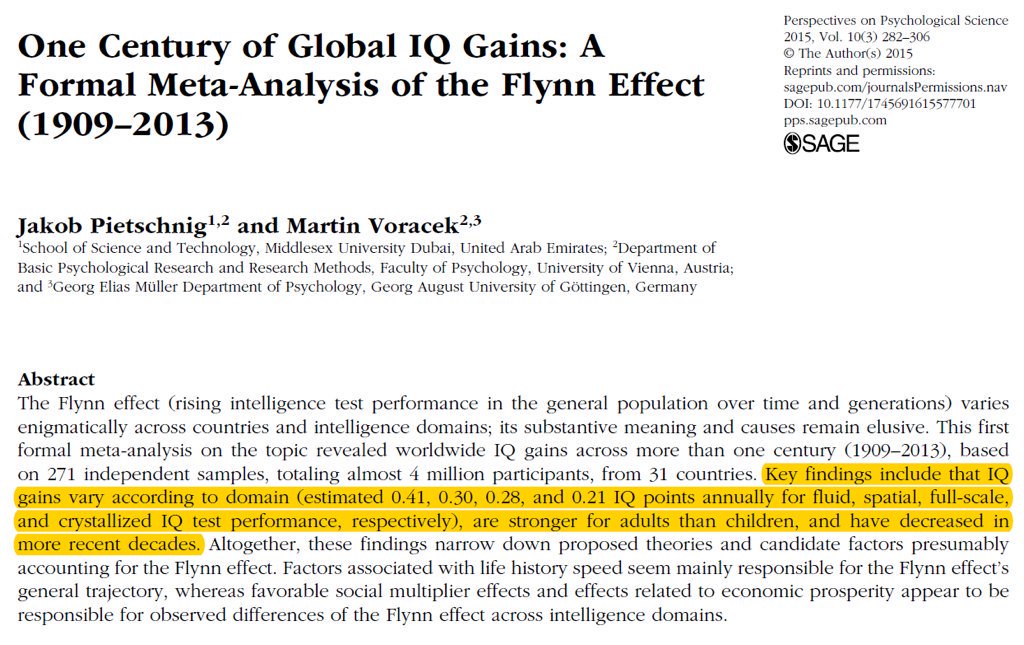
3. IQ scores have been increasing for the last century or so, a phenomenon known as the Flynn effect. https://t.co/sCZvCst3hw (N ≈ 4 million)
(Note that the Flynn effect shows that IQ isn't 100% genetic; it doesn't show that it's 100% environmental.)
4. IQ predicts many important real world outcomes.
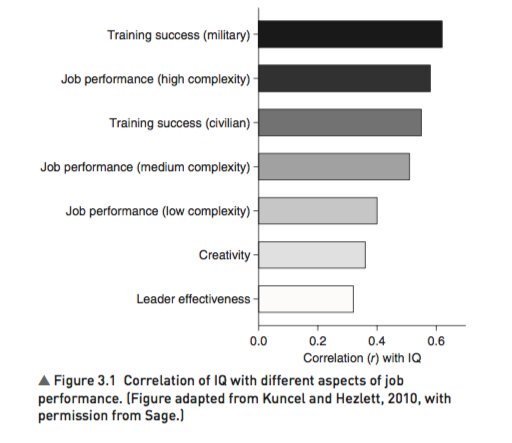
For example, though far from perfect, IQ is the single-best predictor of job performance we have – much better than Emotional Intelligence, the Big Five, Grit, etc. https://t.co/rKUgKDAAVx https://t.co/DWbVI8QSU3
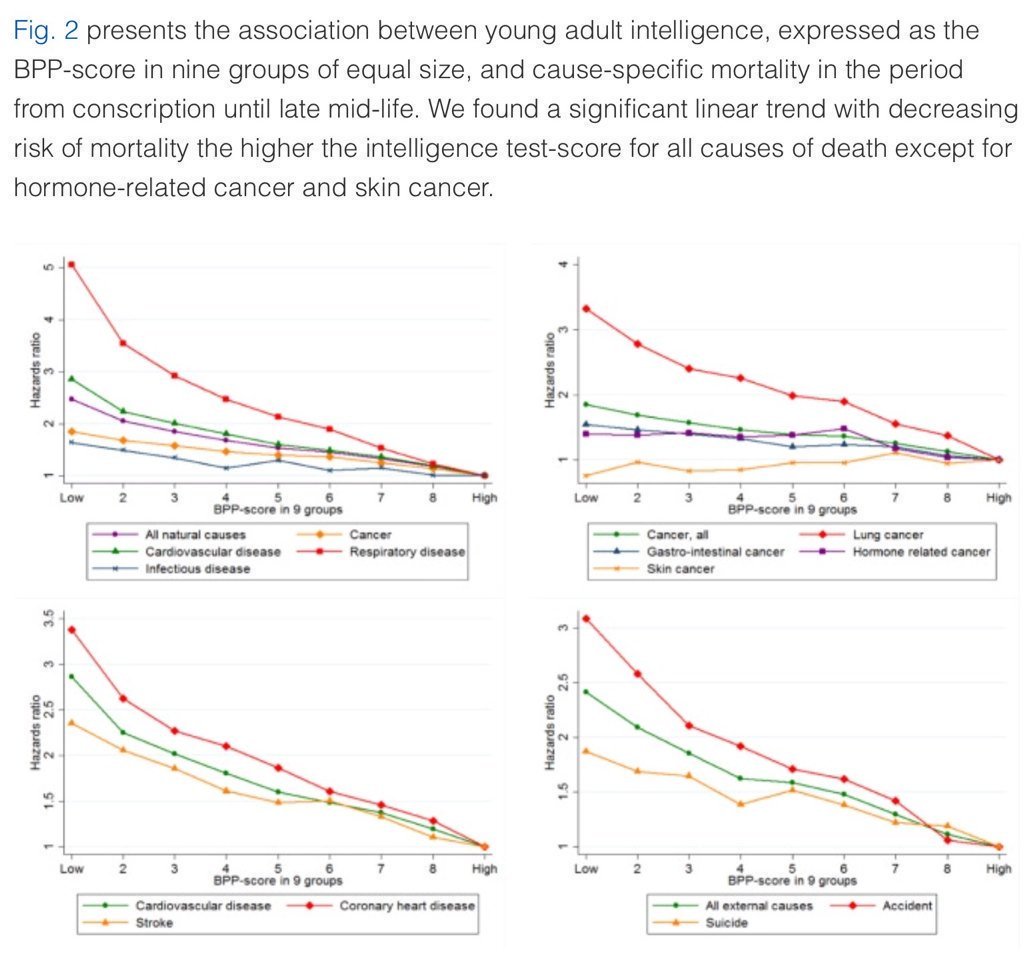
5. Higher IQ is associated with a lower risk of death from most causes, including cardiovascular disease, respiratory disease, most forms of cancer, homicide, suicide, and accident. https://t.co/PJjGNyeQRA (N = 728,160)
1. IQ is one of the most heritable psychological traits – that is, individual differences in IQ are strongly associated with individual differences in genes (at least in fairly typical modern environments). https://t.co/3XxzW9bxLE
2. The heritability of IQ *increases* from childhood to adulthood. Meanwhile, the effect of the shared environment largely fades away. In other words, when it comes to IQ, nature becomes more important as we get older, nurture less. https://t.co/UqtS1lpw3n
3. IQ scores have been increasing for the last century or so, a phenomenon known as the Flynn effect. https://t.co/sCZvCst3hw (N ≈ 4 million)
(Note that the Flynn effect shows that IQ isn't 100% genetic; it doesn't show that it's 100% environmental.)
4. IQ predicts many important real world outcomes.
For example, though far from perfect, IQ is the single-best predictor of job performance we have – much better than Emotional Intelligence, the Big Five, Grit, etc. https://t.co/rKUgKDAAVx https://t.co/DWbVI8QSU3
5. Higher IQ is associated with a lower risk of death from most causes, including cardiovascular disease, respiratory disease, most forms of cancer, homicide, suicide, and accident. https://t.co/PJjGNyeQRA (N = 728,160)