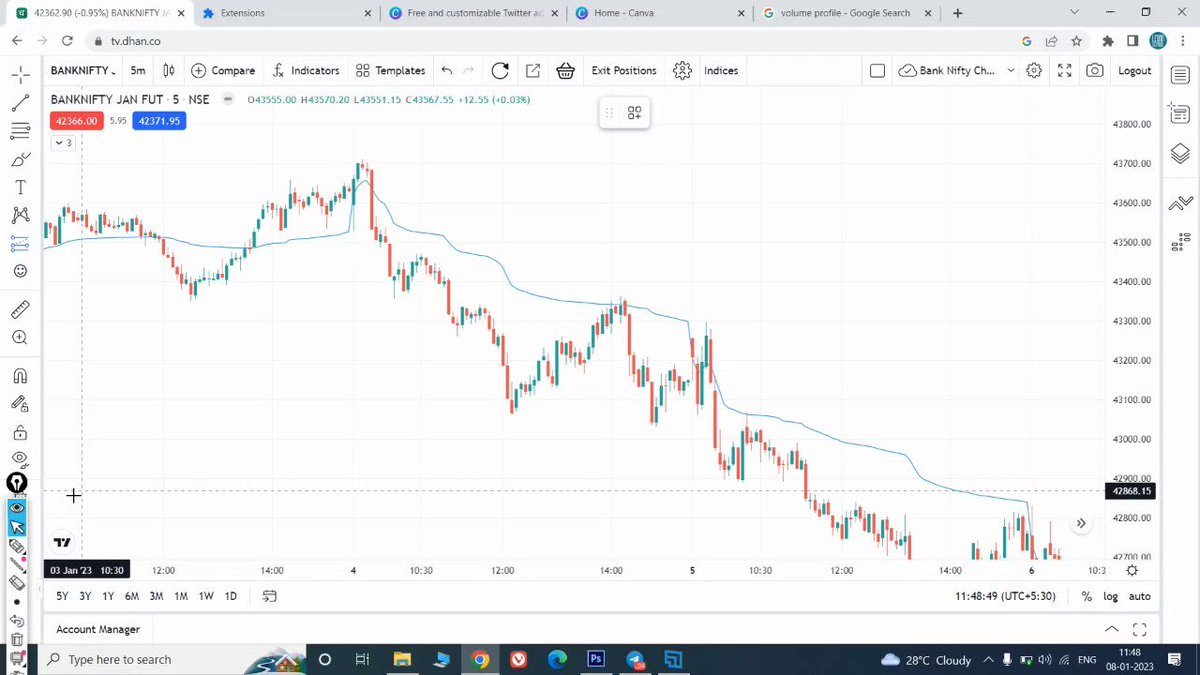
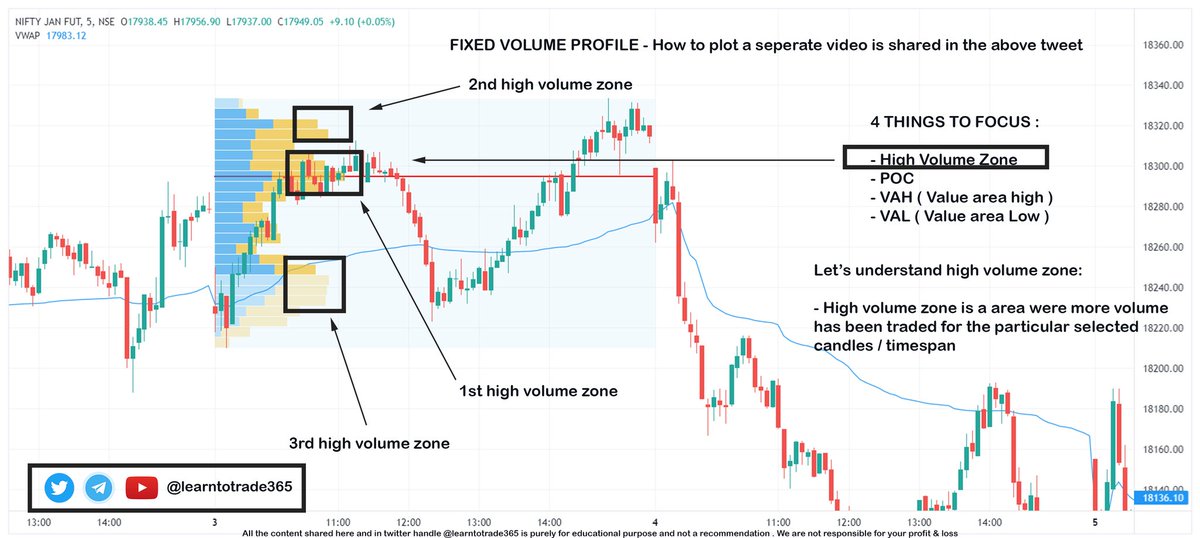
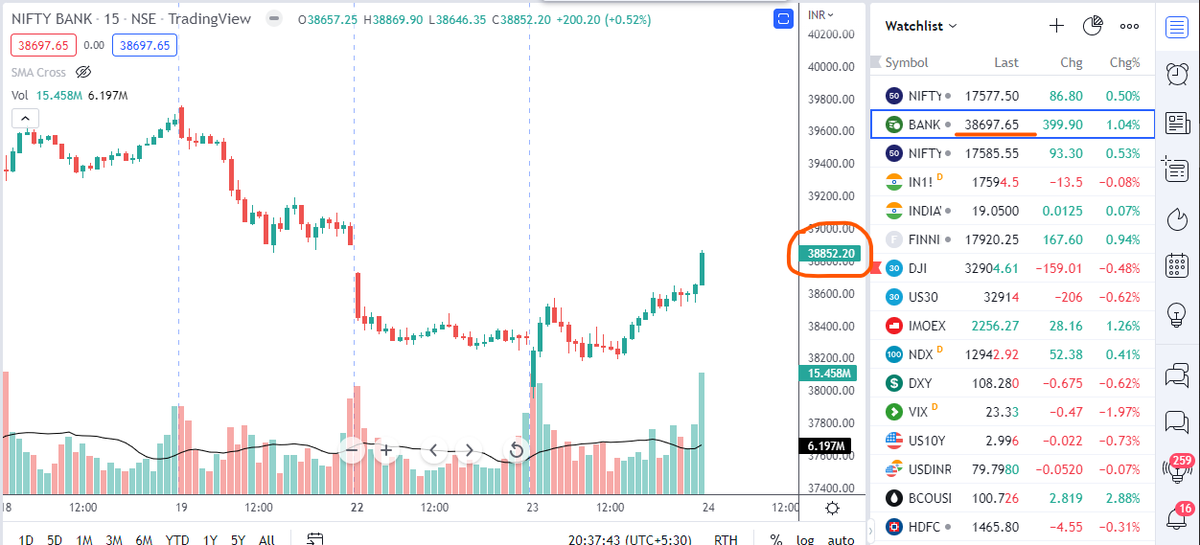
I have made a videos on chartink platform for various screeners

Here's a thread ✌️

Video 1 : Basics of Chartink
https://t.co/zfLEWDtb6q

1/n
Video 2 : How to code indicator on chartink
https://t.co/iCaznKfvfE

2/n
Video 3: Techno Funda Chartink Screener
https://t.co/bAjKsRJ8VV

3/n
Video 4 : Stage 2 Screener
https://t.co/t1c39SiFim

4/n
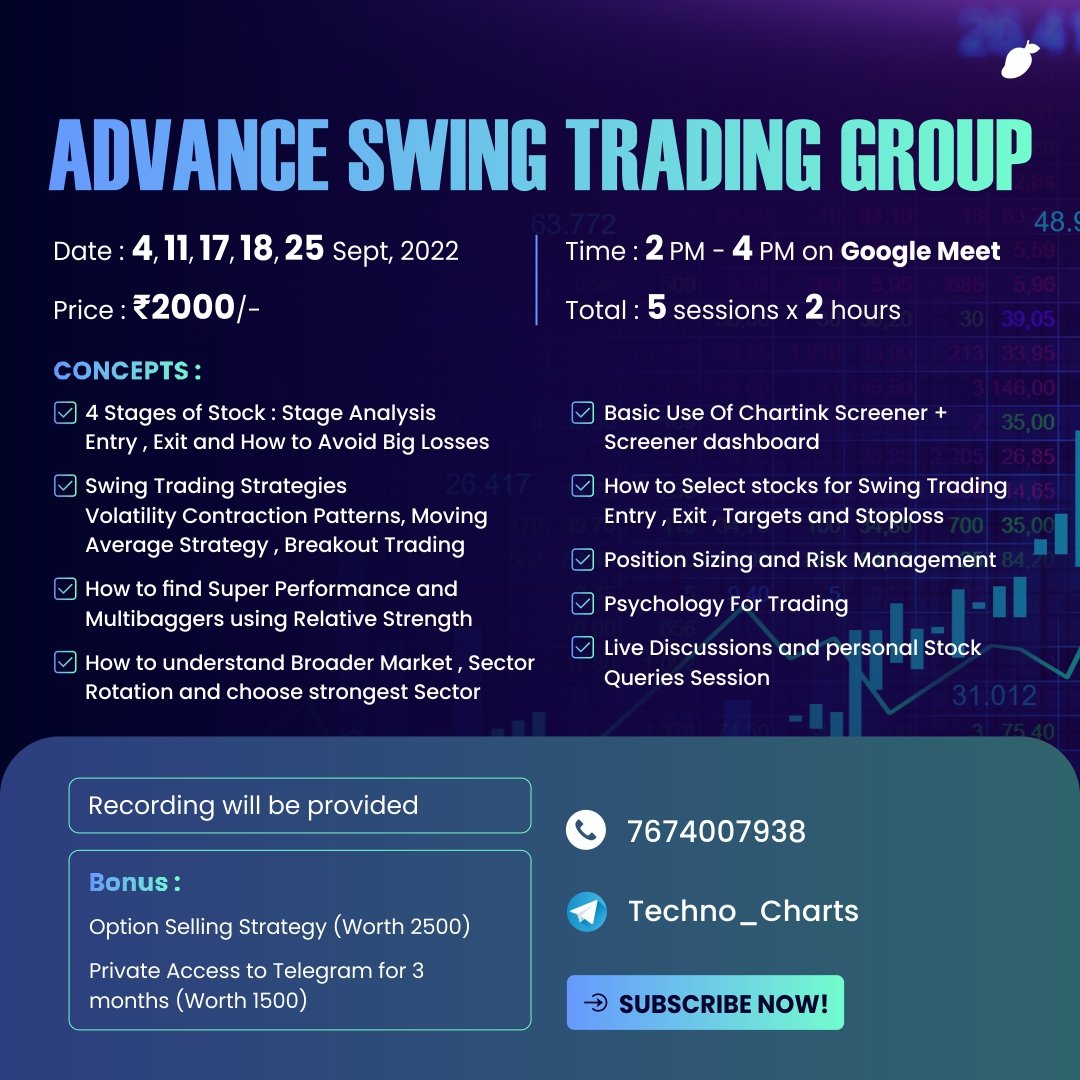
SWING TRADING MENTORSHIP GROUP!

✅Mentorship starting in on 4 September weekends only with recording

LINK FOR ENQUIRY:
https://t.co/Y6WIyvbcjx

Use the link for payment
(You will be added directly in Whatsapp)
https://t.co/fkXUt94fM3
Video 5 : Stage 4 Downtrend Screener

https://t.co/2Ma6NgDzvQ
Telegram Link https://t.co/b4N4oPAto9

More from JayneshKasliwal

Detailed Study of Stocks that became 5X in past 2 Years
A Mega Thread🧵

Concepts :
Relative Strength
Stage Analysis

Retweet and Comment If you want to attend a live session on the same !


We have Got around 86 Stocks that became 5X in 2 years
These Belonged to various sectors and Groups

Excel Link for List of Stocks
https://t.co/jESOUM32b5
1/n


All stocks had few things in common :

Stocks doubled Before entering into Stage 2 Uptrend
52 week RS was positive in stage 2
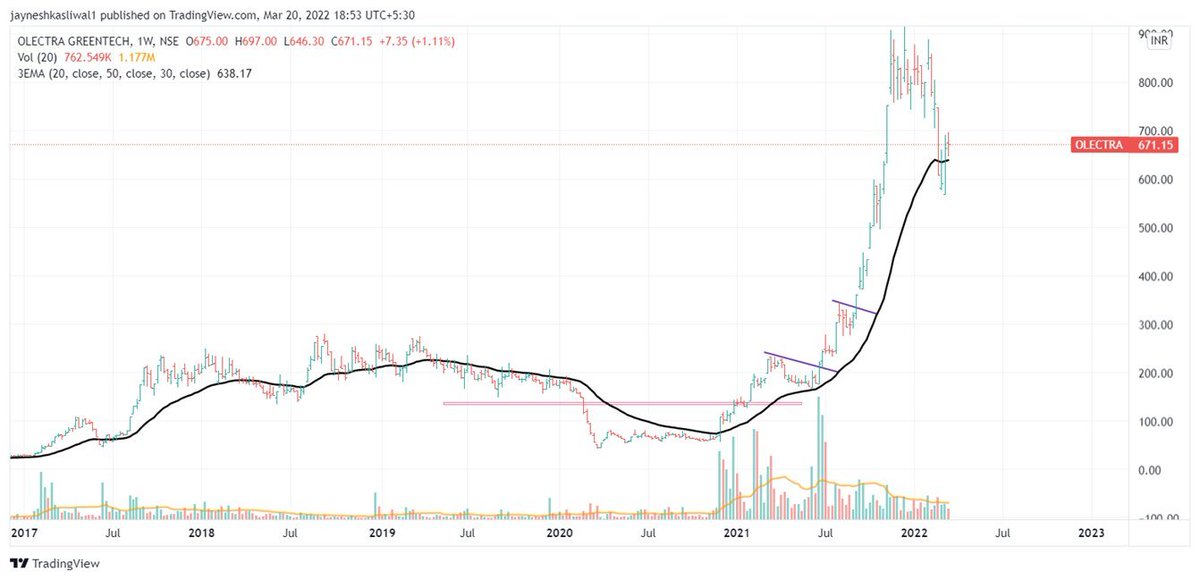
90% stocks even gave all time high breakout after Stage 2
60 Stocks had market cap less than 1000 Cr

Examples : OLECTRA , PGEL
2/n


So What is Relative Strength ?

Relative strength is a strategy used in momentum investing and in identifying value stocks.

It focuses on investing in stocks or other investments that have performed well relative to the market as a whole or to a relevant benchmark.
3/n

How to Apply ?
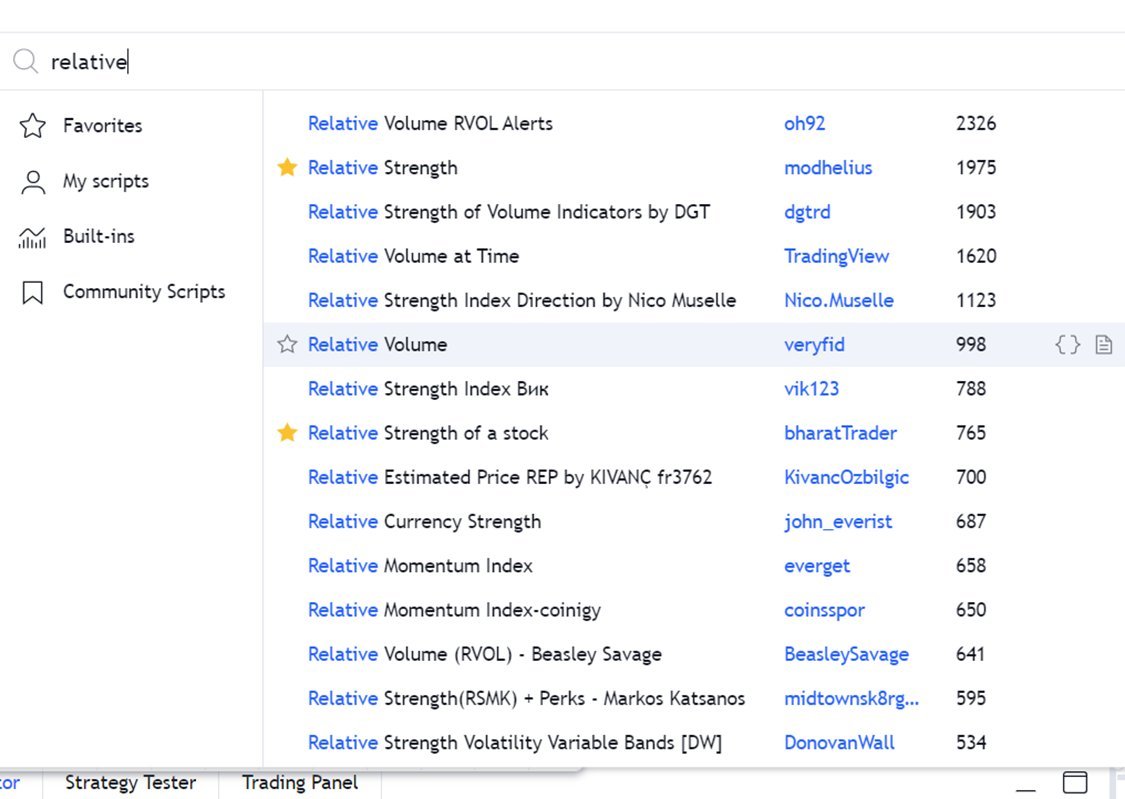
Type
“Relative Strength”
Choose any
By bharattrader
By traderlion
By Modhelius
I use by bharattrader
In setting use 52 period
Use Weekly Chart
4/n
𝟱 𝗧𝗿𝗮𝗱𝗶𝗻𝗴𝘃𝗶𝗲𝘄 𝗜𝗻𝗱𝗶𝗰𝗮𝘁𝗼𝗿𝘀 𝗮𝗹𝗹 𝗧𝗿𝗮𝗱𝗲𝗿𝘀 𝘀𝗵𝗼𝘂𝗹𝗱 𝗸𝗻𝗼𝘄 𝗮𝗯𝗼𝘂𝘁:
𝗣𝗮𝗿𝘁 𝟮

🧵 Thread 🧵
Retweet And I will Link a 36 Page PDF

𝟭. 𝗔𝗱𝗱 𝗙𝘂𝗻𝗱𝗮𝗺𝗲𝗻𝘁𝗮𝗹𝘀 𝗼𝗻 𝗰𝗵𝗮𝗿𝘁
🔸 Link:
https://t.co/HcIXT7V002
🔸 Click on the above link -> Add to Favourites -> Add on Chart from favourites and start using it !
2/20

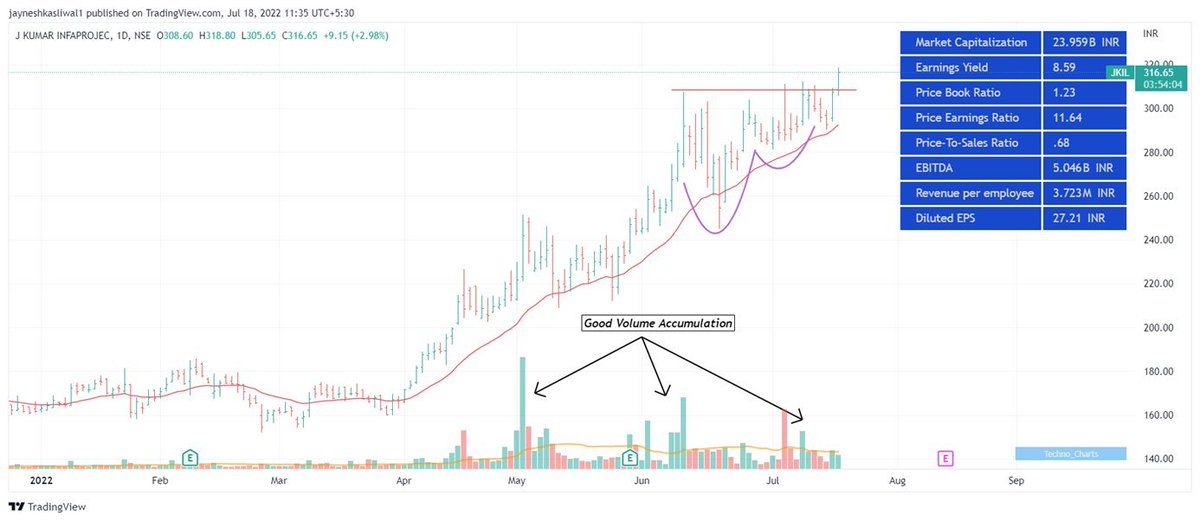
You can add financials from many fundamental criteria's like
🔸 Cashflows
🔸 Income Statements
🔸 Balance sheets
🔸 PE,PB ratios
🔸 Marketcapitlization
🔸 Statistics
3/20


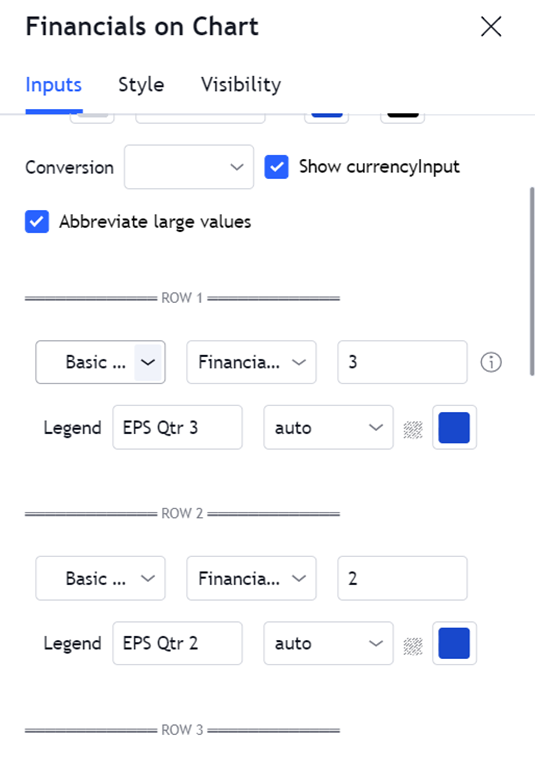
How to change Settings:
🔸 There are 8 columns you can basically select any financial you want
🔸 You can select quarterly or Yearly values and can also write
🔸 The names of the financiaLS Example : EPS Qtr3
🔸 You can Change colours , font size 
4/20


𝟮. 𝗜𝗻𝗱𝗶𝗰𝗮𝘁𝗼𝗿 𝗥𝗮𝘁𝗶𝗻𝗴𝘀
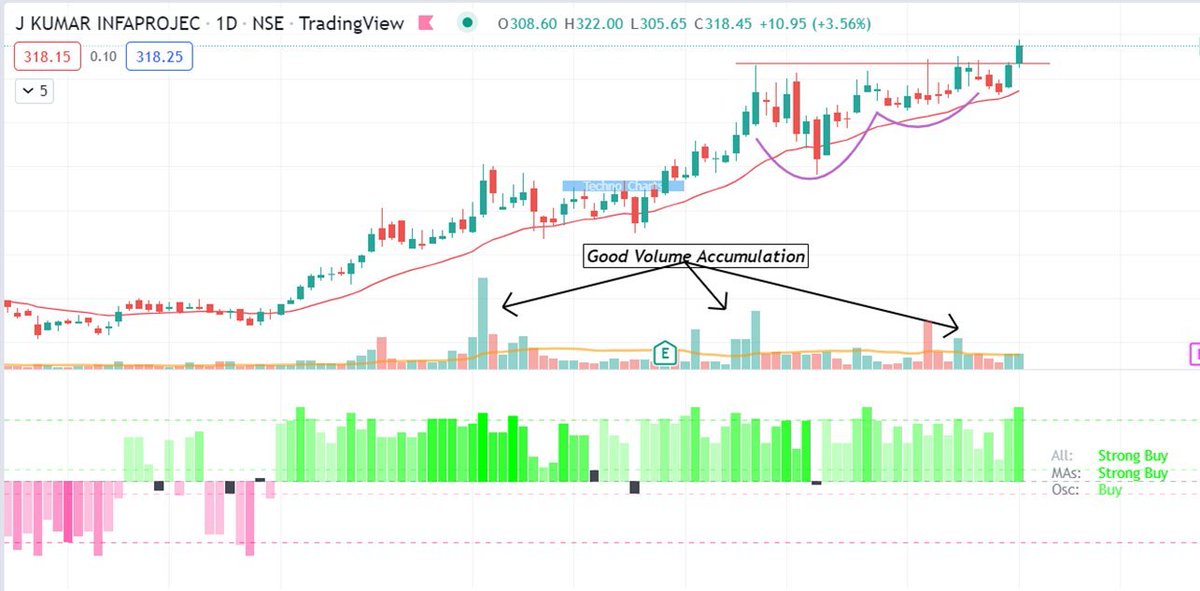
You cannot track each and every indicator like ( 𝗠𝗼𝘃𝗶𝗻𝗴 𝗔𝘃𝗴𝘀 , 𝗥𝗦𝗜 , 𝗠𝗔𝗖𝗗 ) etc , you can use plot this custom strategy to understand whether the trend is positive or negative of those indicators
5/20

More from Catagory trading

Twitter has more than 89,000,000 threads on trading strategies.

Here are top 10 threads that will teach you about Stock Market:

1⃣How To Read a Stock Chart For Beginners by @RichardMoglen
👇


2⃣The simple 8-step process to make a trading plan by @AdityaTodmal


3⃣Thread on Darvas Box Theory


2⃣How to find out high and lows of stock market by
𝗛𝗼𝘄 𝘁𝗼 𝗰𝗿𝗲𝗮𝘁𝗲 𝘆𝗼𝘂𝗿 𝗼𝘄𝗻 𝗖𝗵𝗮𝗿𝘁𝗶𝗻𝗸 𝗦𝗰𝗿𝗲𝗲𝗻𝗲𝗿

🧵 Thread 🧵
[1/15]

𝗖𝗵𝗮𝗿𝘁𝗶𝗻𝗸 𝗦𝗰𝗿𝗲𝗲𝗻𝗲𝗿 is a Stock screening tool that is useful to screen stocks based on Technical & Fundamentals.
🔸 It scans stocks by using technical indicators like RSI, MACD, divergences, etc.
🔸 It also uses fundamental tools like Book Value, EPS,PE etc
[2/15]

How To Create A Scan ?
Go to
https://t.co/JJEJBg3Cd8 & click on 𝘊𝘳𝘦𝘢𝘵𝘦 𝘚𝘤𝘢𝘯 under 𝘚𝘤𝘳𝘦𝘦𝘯𝘦𝘳𝘴.

[3/15]


𝗙𝗶𝗿𝘀𝘁 𝗦𝘁𝗲𝗽 𝗧𝗼 𝗙𝗶𝗹𝘁𝗲𝗿 𝗦𝘁𝗼𝗰𝗸𝘀
We can select segments of stocks of our choice, e.g. cash or futures stocks, Nifty 100 etc.
Click on green ‘+’ icon to add conditions.
[4/15]


𝗖𝗮𝗻𝗱𝗹𝗲 𝗧𝗶𝗺𝗲𝗳𝗿𝗮𝗺𝗲𝘀 & 𝗖𝗼𝗺𝗽𝗮𝗿𝗶𝘀𝗼𝗻 𝗢𝗽𝗲𝗿𝗮𝘁𝗼𝗿𝘀🔸 We can select any timeframe of candles in Chartink, from minutes to years.
🔸 And compare two candles using comparison operators like 𝘌𝘲𝘶𝘢𝘭 𝘵𝘰 or 𝘎𝘳𝘦𝘢𝘵𝘦𝘳 𝘛𝘩𝘢𝘯 , crossovers etc
[5/15]
You might be using chart patterns incorrectly if you've not seen this.

Data says 81% of people trade these patterns incorrectly, and you might be one of them.

Read now or regret later:: A complete guide on Top 5 chart patterns in this thread 🧵:

1/ Rounding Bottom:

Rounding Bottom or U Pattern or Saucer all are one and the same with different names and it is a bullish


2/ Cup and Handle:

A bullish technical pattern that is very popular in Technical


3/ Ascending Triangle:

Ascending triangle is created by price moves that allow for a horizontal line to be drawn along the swing highs and a rising trendline to be drawn along the swing


4/ Head and Shoulder Pattern:

It is one of several top patterns that signal an upward trend is nearing its

You May Also Like