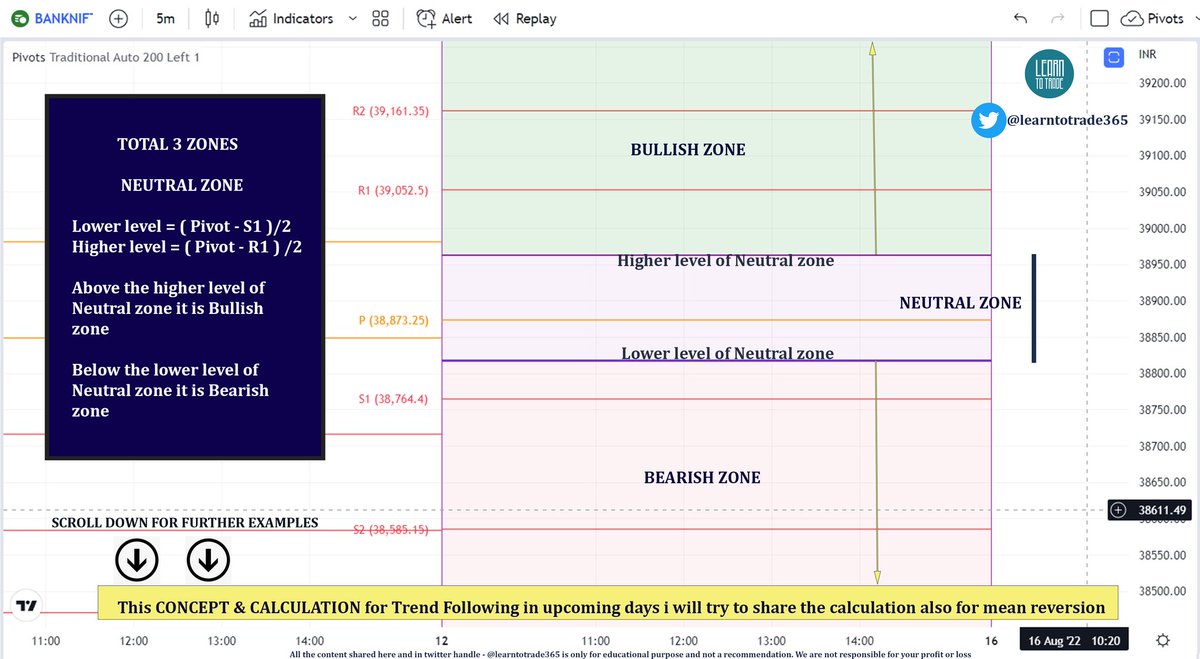
In this Video I have discussed about Mean Reversion Intraday Trading Strategy
More from JayneshKasliwal
𝗡𝗶𝗳𝘁𝘆-𝗕𝗮𝗻𝗸𝗻𝗶𝗳𝘁𝘆 𝗢𝗽𝘁𝗶𝗼𝗻 𝗕𝘂𝘆𝗶𝗻𝗴 𝗦𝘁𝗿𝗮𝘁𝗲𝗴𝘆
Complete Backtest and Indicator link
🧵 A Thread 🧵
𝗦𝗲𝘁𝘂𝗽:
🔸 Monthly Option Buying
🔸 50 ema on 3 min timeframe
🔸 Supertrend 10 , 3
🔸 Chart : Banknifty , Nifty Futures as we backtested on futures
🔸 Entry 9:20 to 3:00
🔸 Max 3 Entries per day
🔸 Premium nearest to 200 Rs only
[2/18]
Why Monthly Option buying ?
🔸 Less theta decay compared to weekly options
🔸 Less Volatility
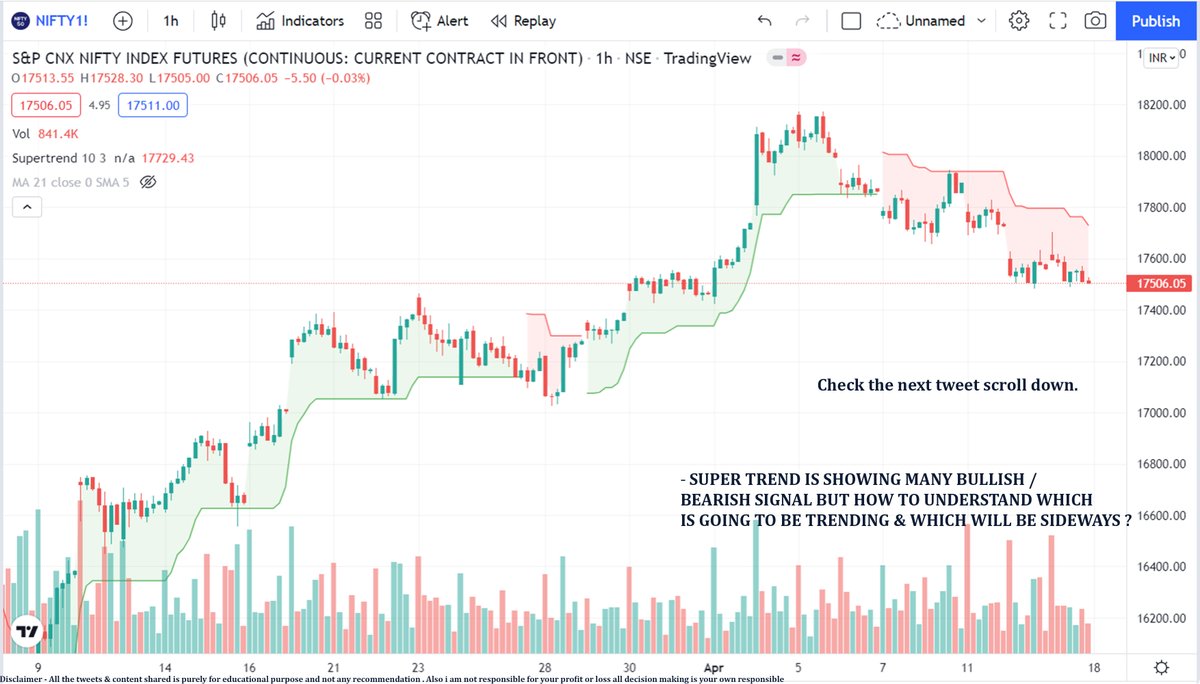
🔸 Supertrend and MA Settings
[3/18]

🔸 Indicator Link
🔸 Click on the below 𝘭𝘪𝘯𝘬 -> 𝘈𝘥𝘥 𝘵𝘰 𝘍𝘢𝘷𝘰𝘶𝘳𝘪𝘵𝘦𝘴 -> 𝘈𝘥𝘥 𝘰𝘯 𝘊𝘩𝘢𝘳𝘵 from favourites and start using it !
🔸 https://t.co/zVXavqLBto
[4/18]
𝗜𝗻𝗱𝗶𝗰𝗮𝘁𝗼𝗿 𝗦𝗲𝘁𝘁𝗶𝗻𝗴𝘀 :
🔸 Max 6 Trades per day ( Both CE and PE buy)
🔸 Timings 9:20 am to 3:00 pm
🔸 Supertrend : 10,3
🔸 Moving Average 50 ema
[5/18]

Complete Backtest and Indicator link
🧵 A Thread 🧵
𝗦𝗲𝘁𝘂𝗽:
🔸 Monthly Option Buying
🔸 50 ema on 3 min timeframe
🔸 Supertrend 10 , 3
🔸 Chart : Banknifty , Nifty Futures as we backtested on futures
🔸 Entry 9:20 to 3:00
🔸 Max 3 Entries per day
🔸 Premium nearest to 200 Rs only
[2/18]
Why Monthly Option buying ?
🔸 Less theta decay compared to weekly options
🔸 Less Volatility
🔸 Supertrend and MA Settings
[3/18]
🔸 Indicator Link
🔸 Click on the below 𝘭𝘪𝘯𝘬 -> 𝘈𝘥𝘥 𝘵𝘰 𝘍𝘢𝘷𝘰𝘶𝘳𝘪𝘵𝘦𝘴 -> 𝘈𝘥𝘥 𝘰𝘯 𝘊𝘩𝘢𝘳𝘵 from favourites and start using it !
🔸 https://t.co/zVXavqLBto
[4/18]
𝗜𝗻𝗱𝗶𝗰𝗮𝘁𝗼𝗿 𝗦𝗲𝘁𝘁𝗶𝗻𝗴𝘀 :
🔸 Max 6 Trades per day ( Both CE and PE buy)
🔸 Timings 9:20 am to 3:00 pm
🔸 Supertrend : 10,3
🔸 Moving Average 50 ema
[5/18]


𝗛𝗼𝘄 𝘁𝗼 𝗰𝗿𝗲𝗮𝘁𝗲 𝘆𝗼𝘂𝗿 𝗼𝘄𝗻 𝗖𝗵𝗮𝗿𝘁𝗶𝗻𝗸 𝗦𝗰𝗿𝗲𝗲𝗻𝗲𝗿
🧵 Thread 🧵
[1/15]
𝗖𝗵𝗮𝗿𝘁𝗶𝗻𝗸 𝗦𝗰𝗿𝗲𝗲𝗻𝗲𝗿 is a Stock screening tool that is useful to screen stocks based on Technical & Fundamentals.
🔸 It scans stocks by using technical indicators like RSI, MACD, divergences, etc.
🔸 It also uses fundamental tools like Book Value, EPS,PE etc
[2/15]
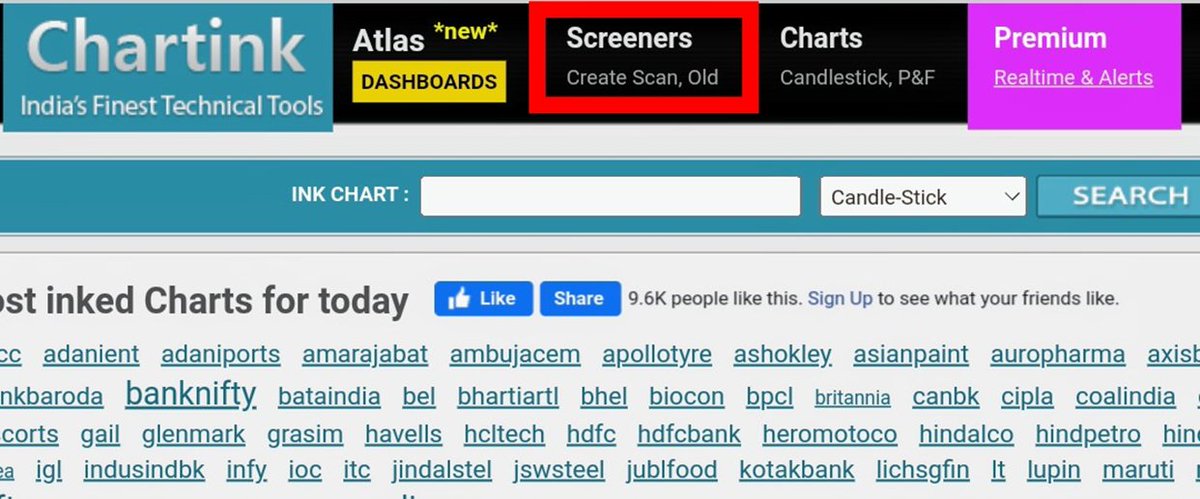
How To Create A Scan ?
Go to https://t.co/JJEJBg3Cd8 & click on 𝘊𝘳𝘦𝘢𝘵𝘦 𝘚𝘤𝘢𝘯 under 𝘚𝘤𝘳𝘦𝘦𝘯𝘦𝘳𝘴.
[3/15]
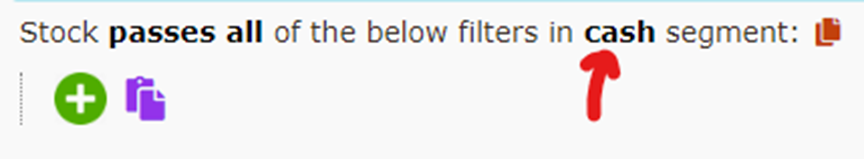
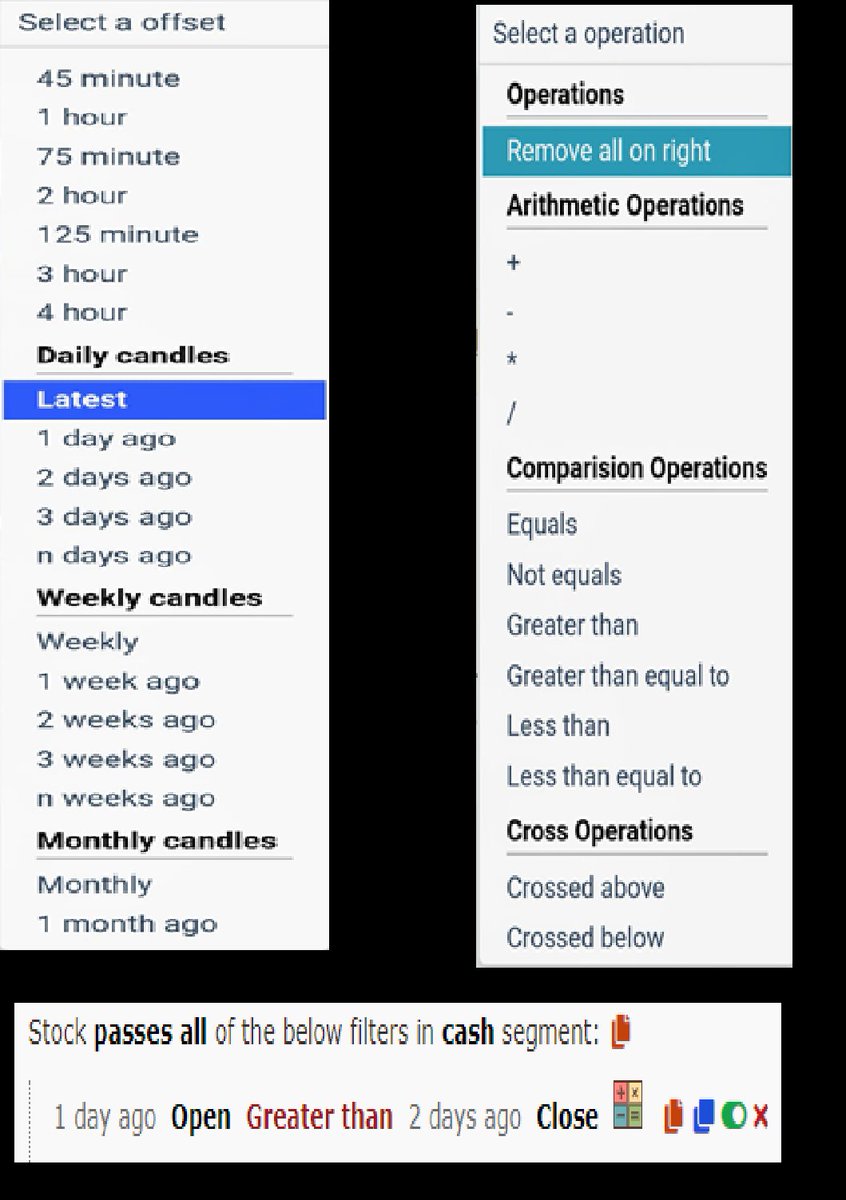
𝗙𝗶𝗿𝘀𝘁 𝗦𝘁𝗲𝗽 𝗧𝗼 𝗙𝗶𝗹𝘁𝗲𝗿 𝗦𝘁𝗼𝗰𝗸𝘀
We can select segments of stocks of our choice, e.g. cash or futures stocks, Nifty 100 etc.
Click on green ‘+’ icon to add conditions.
[4/15]
𝗖𝗮𝗻𝗱𝗹𝗲 𝗧𝗶𝗺𝗲𝗳𝗿𝗮𝗺𝗲𝘀 & 𝗖𝗼𝗺𝗽𝗮𝗿𝗶𝘀𝗼𝗻 𝗢𝗽𝗲𝗿𝗮𝘁𝗼𝗿𝘀🔸 We can select any timeframe of candles in Chartink, from minutes to years.
🔸 And compare two candles using comparison operators like 𝘌𝘲𝘶𝘢𝘭 𝘵𝘰 or 𝘎𝘳𝘦𝘢𝘵𝘦𝘳 𝘛𝘩𝘢𝘯 , crossovers etc
[5/15]
🧵 Thread 🧵
[1/15]
𝗖𝗵𝗮𝗿𝘁𝗶𝗻𝗸 𝗦𝗰𝗿𝗲𝗲𝗻𝗲𝗿 is a Stock screening tool that is useful to screen stocks based on Technical & Fundamentals.
🔸 It scans stocks by using technical indicators like RSI, MACD, divergences, etc.
🔸 It also uses fundamental tools like Book Value, EPS,PE etc
[2/15]
How To Create A Scan ?
Go to https://t.co/JJEJBg3Cd8 & click on 𝘊𝘳𝘦𝘢𝘵𝘦 𝘚𝘤𝘢𝘯 under 𝘚𝘤𝘳𝘦𝘦𝘯𝘦𝘳𝘴.
[3/15]
𝗙𝗶𝗿𝘀𝘁 𝗦𝘁𝗲𝗽 𝗧𝗼 𝗙𝗶𝗹𝘁𝗲𝗿 𝗦𝘁𝗼𝗰𝗸𝘀
We can select segments of stocks of our choice, e.g. cash or futures stocks, Nifty 100 etc.
Click on green ‘+’ icon to add conditions.
[4/15]
𝗖𝗮𝗻𝗱𝗹𝗲 𝗧𝗶𝗺𝗲𝗳𝗿𝗮𝗺𝗲𝘀 & 𝗖𝗼𝗺𝗽𝗮𝗿𝗶𝘀𝗼𝗻 𝗢𝗽𝗲𝗿𝗮𝘁𝗼𝗿𝘀🔸 We can select any timeframe of candles in Chartink, from minutes to years.
🔸 And compare two candles using comparison operators like 𝘌𝘲𝘶𝘢𝘭 𝘵𝘰 or 𝘎𝘳𝘦𝘢𝘵𝘦𝘳 𝘛𝘩𝘢𝘯 , crossovers etc
[5/15]
𝟱 𝗧𝗿𝗮𝗱𝗶𝗻𝗴𝘃𝗶𝗲𝘄 𝗜𝗻𝗱𝗶𝗰𝗮𝘁𝗼𝗿𝘀 𝗮𝗹𝗹 𝗧𝗿𝗮𝗱𝗲𝗿𝘀 𝘀𝗵𝗼𝘂𝗹𝗱 𝗸𝗻𝗼𝘄 𝗮𝗯𝗼𝘂𝘁:
𝗣𝗮𝗿𝘁 𝟮
🧵 Thread 🧵
Retweet And I will Link a 36 Page PDF
𝟭. 𝗔𝗱𝗱 𝗙𝘂𝗻𝗱𝗮𝗺𝗲𝗻𝘁𝗮𝗹𝘀 𝗼𝗻 𝗰𝗵𝗮𝗿𝘁
🔸 Link:
https://t.co/HcIXT7V002
🔸 Click on the above link -> Add to Favourites -> Add on Chart from favourites and start using it !
2/20
You can add financials from many fundamental criteria's like
🔸 Cashflows
🔸 Income Statements
🔸 Balance sheets
🔸 PE,PB ratios
🔸 Marketcapitlization
🔸 Statistics
3/20
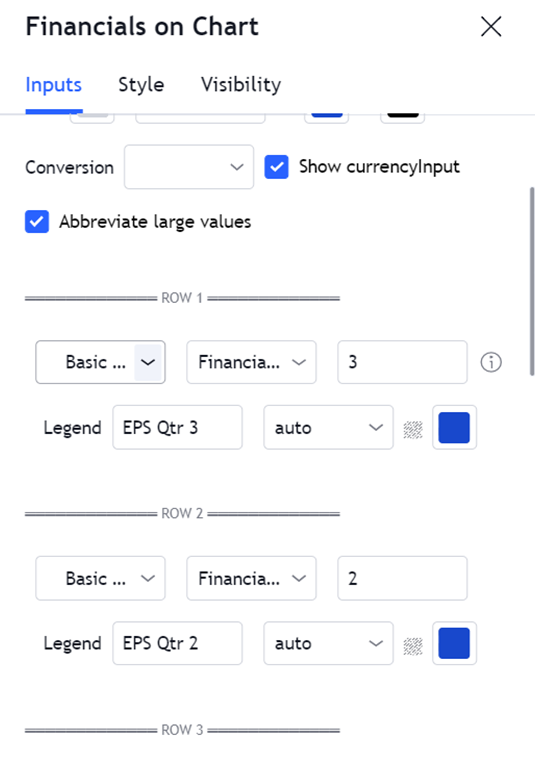
How to change Settings:
🔸 There are 8 columns you can basically select any financial you want
🔸 You can select quarterly or Yearly values and can also write
🔸 The names of the financiaLS Example : EPS Qtr3
🔸 You can Change colours , font size
4/20
𝟮. 𝗜𝗻𝗱𝗶𝗰𝗮𝘁𝗼𝗿 𝗥𝗮𝘁𝗶𝗻𝗴𝘀
You cannot track each and every indicator like ( 𝗠𝗼𝘃𝗶𝗻𝗴 𝗔𝘃𝗴𝘀 , 𝗥𝗦𝗜 , 𝗠𝗔𝗖𝗗 ) etc , you can use plot this custom strategy to understand whether the trend is positive or negative of those indicators
5/20
𝗣𝗮𝗿𝘁 𝟮
🧵 Thread 🧵
Retweet And I will Link a 36 Page PDF
𝟭. 𝗔𝗱𝗱 𝗙𝘂𝗻𝗱𝗮𝗺𝗲𝗻𝘁𝗮𝗹𝘀 𝗼𝗻 𝗰𝗵𝗮𝗿𝘁
🔸 Link:
https://t.co/HcIXT7V002
🔸 Click on the above link -> Add to Favourites -> Add on Chart from favourites and start using it !
2/20
You can add financials from many fundamental criteria's like
🔸 Cashflows
🔸 Income Statements
🔸 Balance sheets
🔸 PE,PB ratios
🔸 Marketcapitlization
🔸 Statistics
3/20
How to change Settings:
🔸 There are 8 columns you can basically select any financial you want
🔸 You can select quarterly or Yearly values and can also write
🔸 The names of the financiaLS Example : EPS Qtr3
🔸 You can Change colours , font size
4/20
𝟮. 𝗜𝗻𝗱𝗶𝗰𝗮𝘁𝗼𝗿 𝗥𝗮𝘁𝗶𝗻𝗴𝘀
You cannot track each and every indicator like ( 𝗠𝗼𝘃𝗶𝗻𝗴 𝗔𝘃𝗴𝘀 , 𝗥𝗦𝗜 , 𝗠𝗔𝗖𝗗 ) etc , you can use plot this custom strategy to understand whether the trend is positive or negative of those indicators
5/20