There are 1000s of indicators in Technical Analysis...

But you need to MASTER ONLY ONE🎯to win in markets...

I selected 'Commodity channel index' (CCI) as my PRIMARY INDICATOR & all my scanners are a variation of this...

MULTI TIMEFRAME POSITIONAL STRATEGY using CCI...🧵

1⃣ CCI Basics

• CCI > 100 = Bullish and overbought
• CCI < -100 = Bearish and oversold
2⃣Entry criteria

• CCI(34) on Weekly crossed above 100
• CCI(34) on Daily >100
• Entry: above weekly swing high
• Stoploss: Recent swing low on daily chart
3⃣Exit criteria

• CCI(34) on Daily < -100
• Holding period: Few days to many months

Pyramiding your winners should be considered to make your winners big.

Separate post on this to follow.
4⃣ Why trade on a multi-timeframe?

• This is a top-down approach where we observe the larger trend of the stock before we take entries on the smaller or medium trend of the stock. This concept can be compared to tides in the sea.
5⃣ A larger wave in the sea will overpower the smaller waves, no matter what, simply because the larger waves have more velocity and force.

In a similar way, a stock trending in the larger TF will overpower the smaller TF trend and will eventually take the stock price higher.
6⃣ While trading this strategy we presume this will work & buy stock in the shorter TF just when the larger TF is showing bullishness. This ensures we are in the right direction.

In case the stock reverses, we exit based on the stop loss or based on the exit criteria.
7⃣ Just to be clear, this is NOT a holy grail strategy but helps one catch the shorter/medium trend very well.

You WILL have losing trades.

So, it is important to consider proper position sizing and assess your risk before entry.

Let's look at some examples 👇
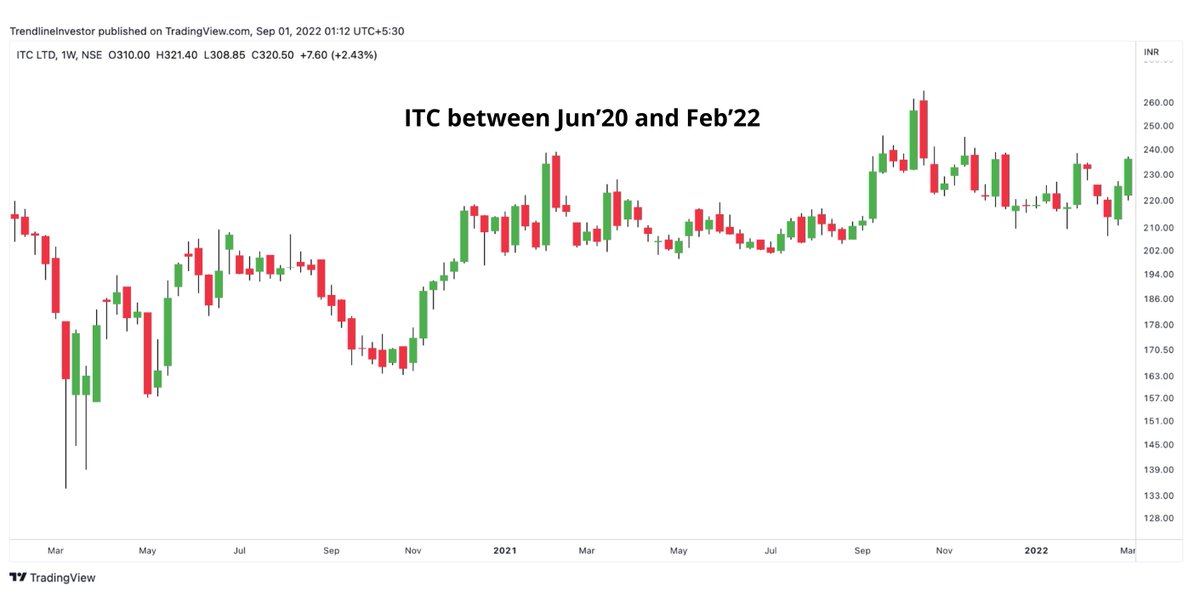
8⃣ Ex: SBIN & Reliance

The larger trend turned bullish. So, we enter just above the weekly high and hold on until the stop hits or exit criteria is met.

Note that by buying just above the high, you skip that initial short term downtrend or you might even skip many bad trades
9⃣ Ex: Axis Bank and Maruti.

Once CCI daily goes below -100, you need to exit the next day at open. You never know how deep the stock can correct.
🔟Ex: Bajaj Finance and HDFC Bank - Good Profits.

You never know much a stock can rally. So, identify a strategy that can keep you in the trade for as long as possible.

Remember, 80% of your profits come from such 20% of trades. Such trades make up your PnL in the long run.
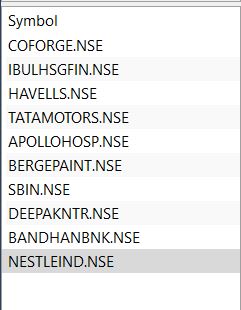
Do run this strategy over many stocks to understand it https://t.co/P4cc8OZSIT

If you loved this strategy👇

1. Retweet the first post in this thread
2. Follow @dmdsplyinvestor
3. Subscribe to my YouTube channel for more content! https://t.co/yNCTzHVRsy

More from Trendline Investor

More from Screeners

You May Also Like

A brief analysis and comparison of the CSS for Twitter's PWA vs Twitter's legacy desktop website. The difference is dramatic and I'll touch on some reasons why.

Legacy site *downloads* ~630 KB CSS per theme and writing direction.

6,769 rules
9,252 selectors
16.7k declarations
3,370 unique declarations
44 media queries
36 unique colors
50 unique background colors
46 unique font sizes
39 unique z-indices

https://t.co/qyl4Bt1i5x


PWA *incrementally generates* ~30 KB CSS that handles all themes and writing directions.

735 rules
740 selectors
757 declarations
730 unique declarations
0 media queries
11 unique colors
32 unique background colors
15 unique font sizes
7 unique z-indices

https://t.co/w7oNG5KUkJ


The legacy site's CSS is what happens when hundreds of people directly write CSS over many years. Specificity wars, redundancy, a house of cards that can't be fixed. The result is extremely inefficient and error-prone styling that punishes users and developers.

The PWA's CSS is generated on-demand by a JS framework that manages styles and outputs "atomic CSS". The framework can enforce strict constraints and perform optimisations, which is why the CSS is so much smaller and safer. Style conflicts and unbounded CSS growth are avoided.