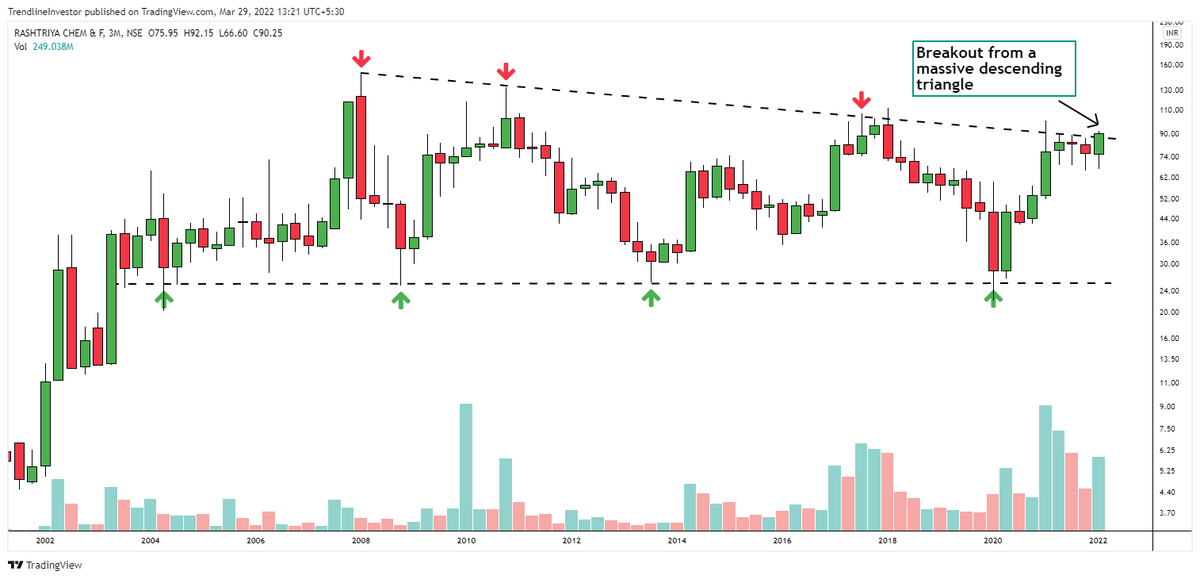
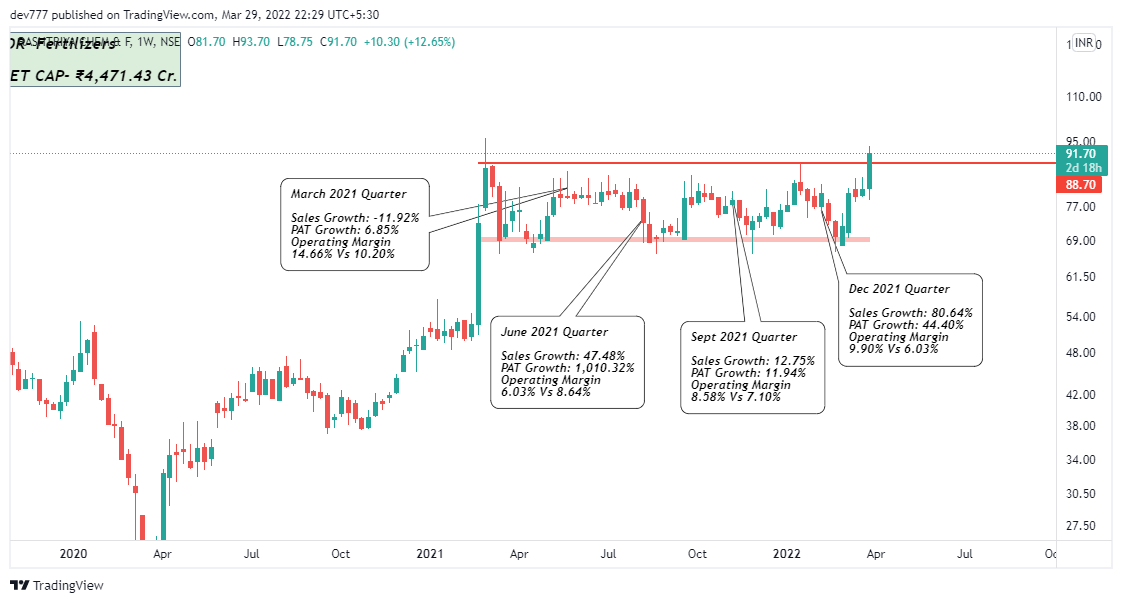
#RCF quarterly chart
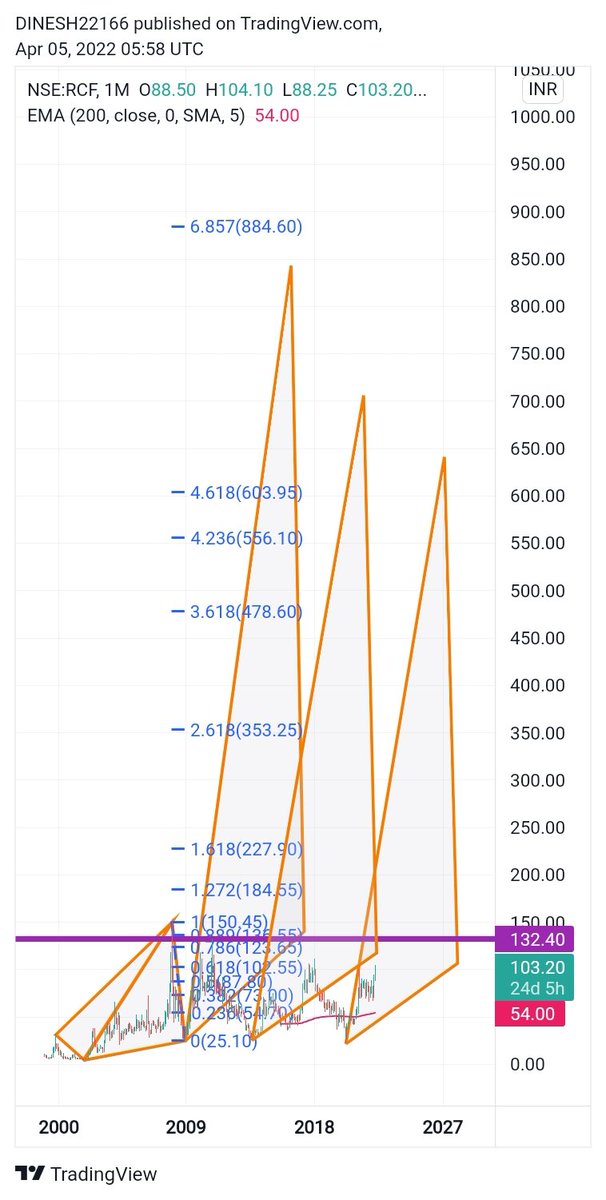
Breaking out from a massive 15-year long descending triangle.
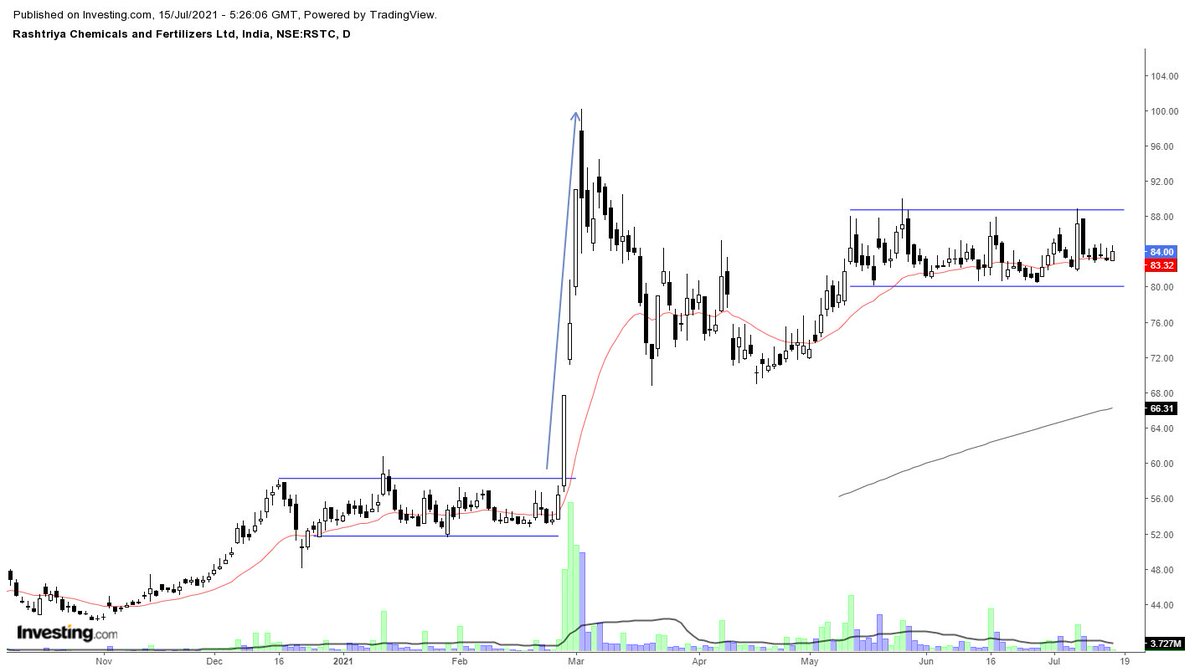
Price has been in a tight range in the last 1 year.
This could just be the beginning of a new long-term uptrend.
Stop - 78.
#stockideas
More from Trendline Investor
- CCI never went into bearish territory
- Relative strength hits new highs
Expecting a strong move next week! https://t.co/rDCnSOFkxs
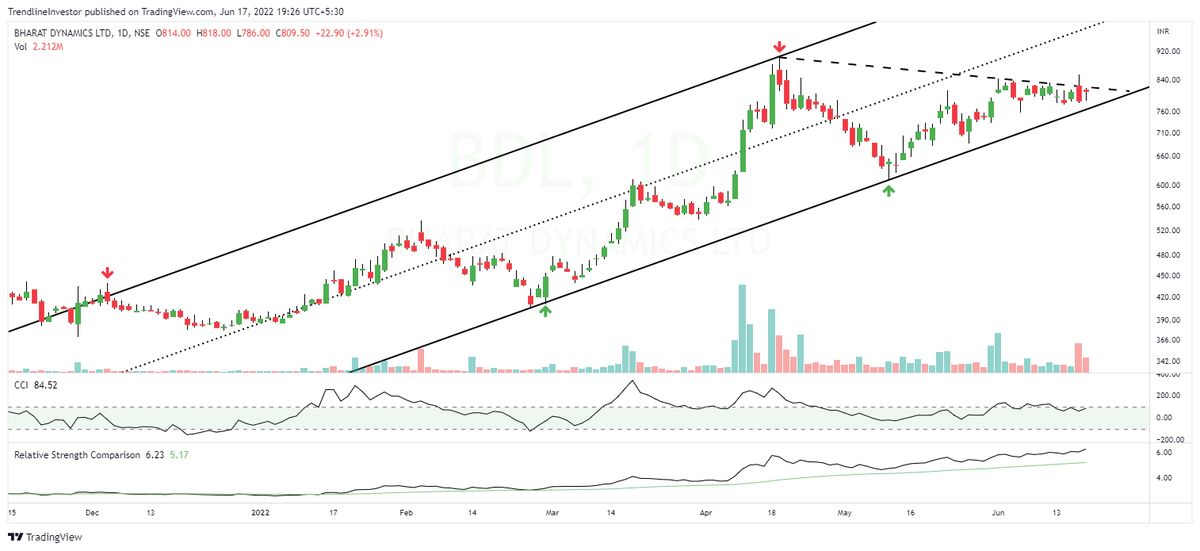
The consolidation I mentioned in #BDL is in progress and if I want to take fresh/add more to the current positions this is one way to do it - Trendline retest!
— Trendline Investor (@dmdsplyinvestor) May 4, 2022
One can also wait for a reversal confirmation before adding. https://t.co/qcUntm9NEz pic.twitter.com/5lgT8aZZpB
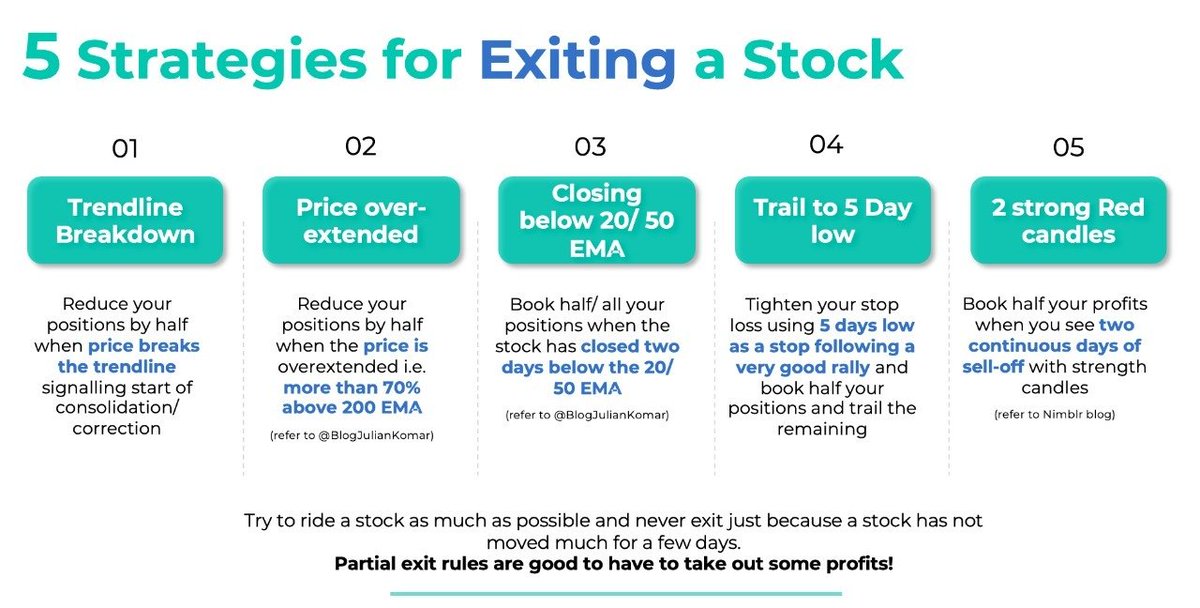
Here are 6⃣ simple strategies which you can use if you are still struggling to trade cash stocks!
They are very simple yet very effective if you can stick to them🤓
Ready to learn?
Let's go🧵...
1⃣ CCI & Pivot based strategy to ride massive trends in stocks
Don't forget to checkout the fundamental
For 7 yrs I struggled to ride trends..
— Trendline Investor (@dmdsplyinvestor) April 30, 2022
& in 2015-17 when I started learning TA smthng crazy happened..
Here is a simple strategy that helped me..
\u2022 Identify turning points in stocks
\u2022 Find quality stocks
\u2022 Not panic & ride trends
\u2022 Finally make \U0001f4b8
CCI & Pivot Strategy\U0001f9f5.. pic.twitter.com/S0QFx00541
2⃣ Multi-time frame positional strategy based on CCI with
There are 1000s of indicators in Technical Analysis...
— Trendline Investor (@dmdsplyinvestor) May 12, 2022
But you need to MASTER ONLY ONE\U0001f3afto win in markets...
I selected 'Commodity channel index' (CCI) as my PRIMARY INDICATOR & all my scanners are a variation of this...
MULTI TIMEFRAME POSITIONAL STRATEGY using CCI...\U0001f9f5 pic.twitter.com/4O2PrBxSw9
3⃣ Only CCI based investment strategy - You can catch massive trends in stocks with good Sales/PAT growth using this
My CCI based investment strategy - How does it work? A thread.
— Trendline Investor (@dmdsplyinvestor) May 23, 2020
Objective: Identify stocks that are entering a phase of momentum on the upside and ride the stock until momentum weakens.1/n
4⃣ Tradingview code for strategy shared by @heartwon based on the long term and short term
A brilliant concept based on the long term and short term EMA by @heartwon. I'm here on twitter for such stuff that helps me build my systems. Really good one. Here is the trading view indicator that I coded. Please RT for everyone's benefit. 1/3 https://t.co/uleWiysyL1
— Trendline Investor (@dmdsplyinvestor) July 5, 2020


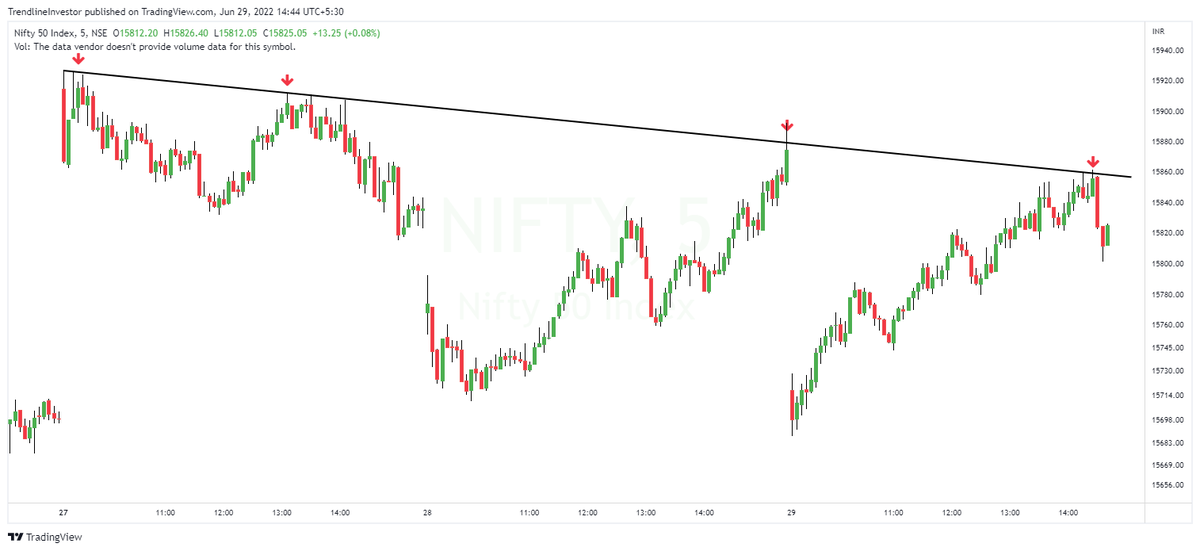
#Nifty perfect reversal after filling the gap and testing the middle of the channel.
— Trendline Investor (@dmdsplyinvestor) June 28, 2022
Waiting for Nifty to take out that major horizontal resistance and then we can see a good short term rally. https://t.co/m3hwcWno9q pic.twitter.com/WhhLPc9JaC
More from Rcf






You May Also Like

1 - open trading view in your browser and select stock scanner in left corner down side .
2 - touch the percentage% gain change ( and u can see higest gainer of today)
Making thread \U0001f9f5 on trading view scanner by which you can select intraday and btst stocks .
— Vikrant (@Trading0secrets) October 22, 2021
In just few hours (Without any watchlist)
Some manual efforts u have to put on it.
Soon going to share the process with u whenever it will be ready .
"How's the josh?"guys \U0001f57a\U0001f3b7\U0001f483
3. Then, start with 6% gainer to 20% gainer and look charts of everyone in daily Timeframe . (For fno selection u can choose 1% to 4% )
4. Then manually select the stocks which are going to give all time high BO or 52 high BO or already given.
5. U can also select those stocks which are going to give range breakout or already given range BO
6 . If in 15 min chart📊 any stock sustaing near BO zone or after BO then select it on your watchlist
7 . Now next day if any stock show momentum u can take trade in it with RM
This looks very easy & simple but,
U will amazed to see it's result if you follow proper risk management.
I did 4x my capital by trading in only momentum stocks.
I will keep sharing such learning thread 🧵 for you 🙏💞🙏
Keep learning / keep sharing 🙏
@AdityaTodmal