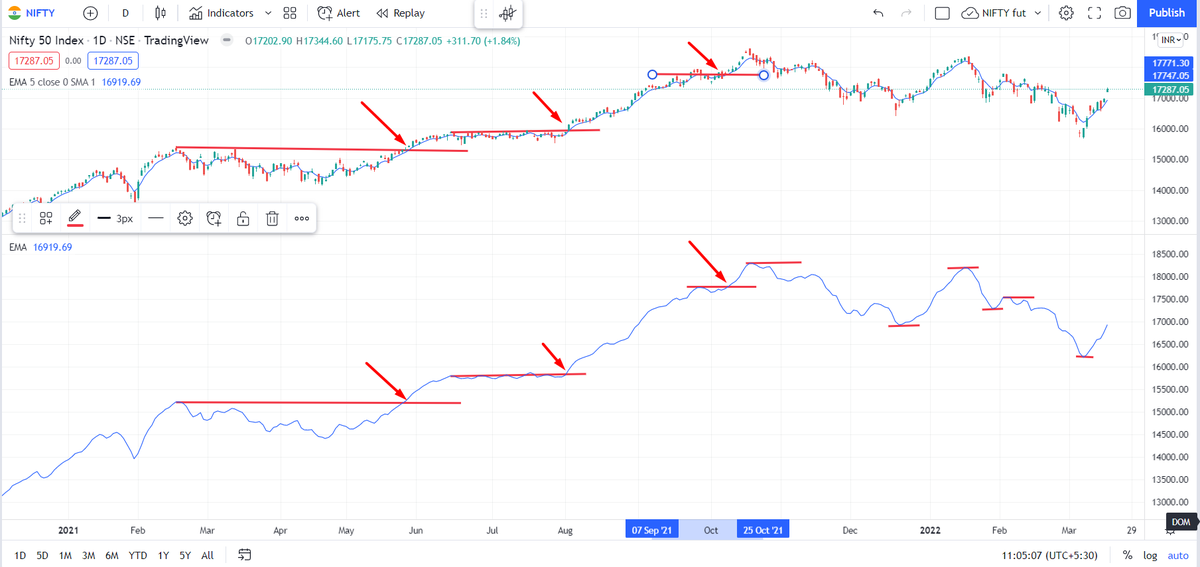
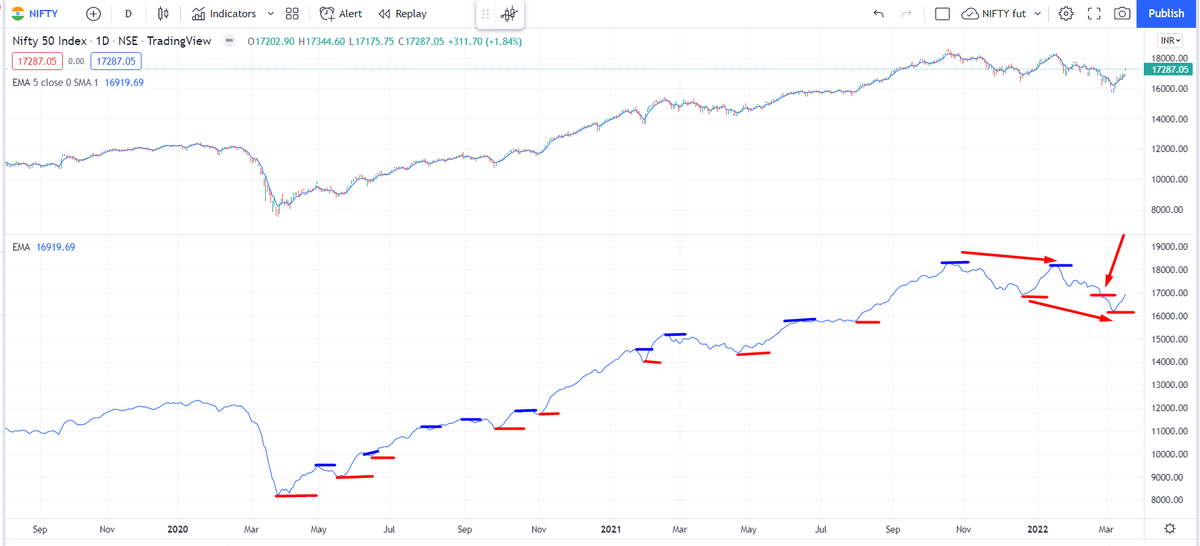
The most important question now on the mind of all analysts and traders. Is this a bear market rally or is this the start of a bull move. Retweeting this as I will need a few tweets to explain my view
Is Nifty bullish, or bearish?
— AP (@ap_pune) March 19, 2022
Replies MUST be ONLY with charts, not just 'views', no Russia Ukraine, crude, gold etc.
Can be levels....abv/below
Just technicals....maybe with trend lines, indicators or any other study (EW, harmonics etc)
Charts can be daily, weekly or monthly.

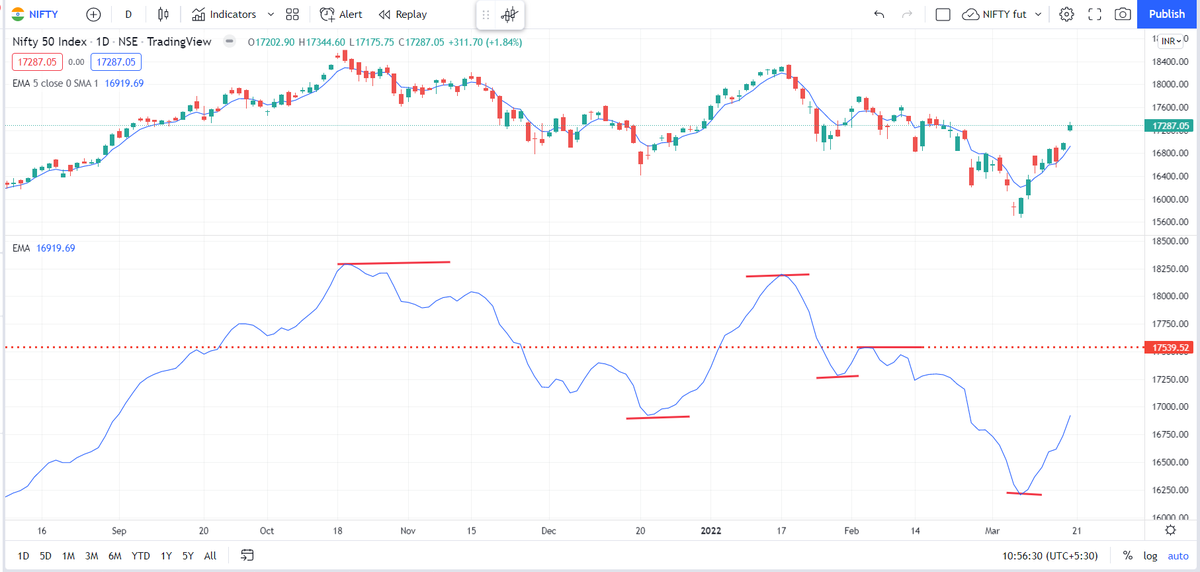
That is not the case now, which holds me back from calling this a clean bull market


More from Subhadip Nandy
Perhaps you have the idea that calling me " 1 lot Nandy" is somehow derogatory and a easy poke at me. Allow me to explain why I look at this moniker as a badge of honour
I have traded 1 lot continuously twice in my life. The first in 2003 after I blew up on my INFY trade. I traded 1 lot ACC fut consistently and made 50k in a month
The 2nd time in 2013. When I suffered continuous losses for 5-6 months due to a variety of psychological issues. Then I traded 1 lot Nifty options consistently for 3 months. After that 2 lots for next 1 month and slowly increased
I have shared these two incidents on my various interveiws and regularly share this in detail with my handholding students when I talk about trading psychology.
This logic of trading 1 lot to iron out trading issues I learnt from the interview of Anthony Saliba, who traded 1 lot in options for 6 months. BTW, Saliba was the only options trader to have been profiled on the original Market Wizards ( I read his interview and used his logic)
Sir itseems people call you as "one lot Nandy".. Is it true?
— Bittu (@nanoobittu) July 16, 2021
I have traded 1 lot continuously twice in my life. The first in 2003 after I blew up on my INFY trade. I traded 1 lot ACC fut consistently and made 50k in a month
The 2nd time in 2013. When I suffered continuous losses for 5-6 months due to a variety of psychological issues. Then I traded 1 lot Nifty options consistently for 3 months. After that 2 lots for next 1 month and slowly increased
I have shared these two incidents on my various interveiws and regularly share this in detail with my handholding students when I talk about trading psychology.
This logic of trading 1 lot to iron out trading issues I learnt from the interview of Anthony Saliba, who traded 1 lot in options for 6 months. BTW, Saliba was the only options trader to have been profiled on the original Market Wizards ( I read his interview and used his logic)
Ok here is the explanation. Grab a cup of coffee and read on. If you have not read/noticed this, you will see intraday options movement in a new light.
Say we have two options, one 50 delta ATM options and another 30 delta OTM option. Normally for a 100 point move, the ATM option will move 50 points and the OTM option will move 30 points. But in a high volatile environment, the OTM option will also move nearly 50 points
To understand why this happens, first understand why an ATM option is 50 delta. An ATM option has the probability of 50% of expiring as ITM. The price just has to close a rupee above the strike for the CE to be ITM and vice versa for PEs
Now think of a highly volatile day like today. If someone is asked where the BNF will close for the day or expiry, no one can answer. BNF can close freakin anywhere, That makes every option of an equal probability of being ITM. So all options have a 50% probability of being ITM
Hence, when a huge volatile move starts, all OTM options behave like ATM options. This phenomenon was first observed in the Black Monday crash of 1987 at Wall Street, which also gave rise to the volatility skew/smirk
In a high IV environment or when the market is very volatile
— Subhadip Nandy (@SubhadipNandy16) January 21, 2022
" OTM options will behave like ATM options", one will get almost the same delta movement
Say we have two options, one 50 delta ATM options and another 30 delta OTM option. Normally for a 100 point move, the ATM option will move 50 points and the OTM option will move 30 points. But in a high volatile environment, the OTM option will also move nearly 50 points
To understand why this happens, first understand why an ATM option is 50 delta. An ATM option has the probability of 50% of expiring as ITM. The price just has to close a rupee above the strike for the CE to be ITM and vice versa for PEs
Now think of a highly volatile day like today. If someone is asked where the BNF will close for the day or expiry, no one can answer. BNF can close freakin anywhere, That makes every option of an equal probability of being ITM. So all options have a 50% probability of being ITM
Hence, when a huge volatile move starts, all OTM options behave like ATM options. This phenomenon was first observed in the Black Monday crash of 1987 at Wall Street, which also gave rise to the volatility skew/smirk
More from Screeners
On the occasion of youtube 20k and Twitter 70k members
A small tribute/gift to members
Screeners
technical screeners - intraday and positional both
before proceeding - i have helped you , can i ask you so that it can help someone else too
thank you
positional one
run - find #stock - draw chart - find levels
1- Stocks closing daily 2% up from 5 days
https://t.co/gTZrYY3Nht
2- Weekly breakout
https://t.co/1f4ahEolYB
3- Breakouts in short term
https://t.co/BI4h0CdgO2
4- Bullish from last 5
intraday screeners
5- 15 minute Stock Breakouts
https://t.co/9eAo82iuNv
6- Intraday Buying seen in the past 15 minutes
https://t.co/XqAJKhLB5G
7- Stocks trading near day's high on 5 min chart with volume BO intraday
https://t.co/flHmm6QXmo
Thank you