Authors Ravi Sharma

1) Volatility, Volume & daily range compression scanner
2) Punch-Drunk-Love
3) GE Ratio - to track fundamentally strong stocks
4) Recently created one to track Power Play setups.
I get around 150-200 stocks daily & choose the ones with the most potential.
Sir, How do u find a set up - Do you track chart of each stock daily ? Or do u have filters , that lead you to a number of stocks , after which you scan them.
— AKASH GUPTA (@lockdownmurti) August 25, 2021
Since market cap of IRCTC is good, I reduced the move rule from 40% to 30% in this case. https://t.co/qzL5rgmtg8
Just a small doubt . I sold Yesterday thinking it was a climax 6% move . How did you decide to sell today ?
— Volatility and Volume Trader (@VolVolatTrader) September 7, 2021
Any rules where you sell positions . Just to learn
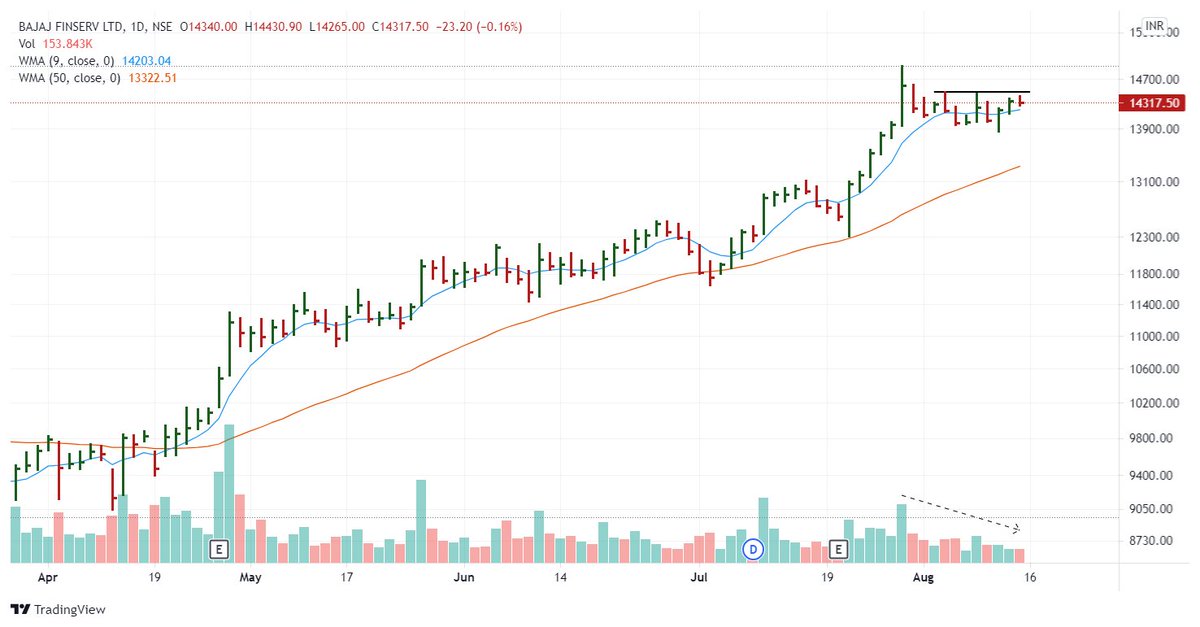
While buying breakouts, your odds will improve a lot when you prefer the following:
1. Strong Relative Strength.
2. Tight price range on low Volume and a pattern which is easy on eyes. https://t.co/CprKpAfgtj
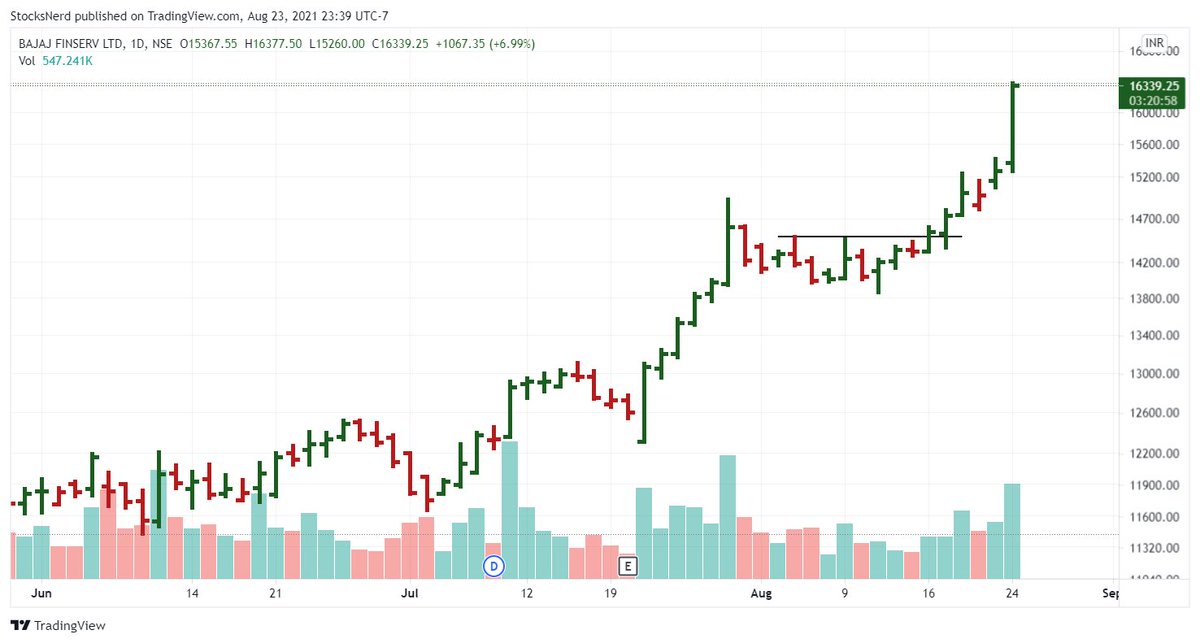
#BAJAJFINSV
— Ravi Sharma (@StocksNerd) August 14, 2021
Setting up in a tight base. Volume has been drying up.
Waiting for the breakout. pic.twitter.com/KWoGZAwkLO
1) 50 WMA > 100 WMA > 150 WMA > 200 WMA
2) Price is within 25% range of its 52-Week High and above 30% or more from its 52-Week Low.
Just one question , how do u differentiate stage 2 from 1 , apart from volume , what else do u look ?
— Priyanshu (@Priyans48107837) August 6, 2021
You would find the roots of all patterns, especially the trend/momentum following ones in their methods.
Once you get the dynamics of Price/Volume, any good book on chart patterns will do.
Any book in which we can read such patterns and the knowledge you have?
— Krish (@MasculinityMon1) August 13, 2021
But I can give you some pointers-
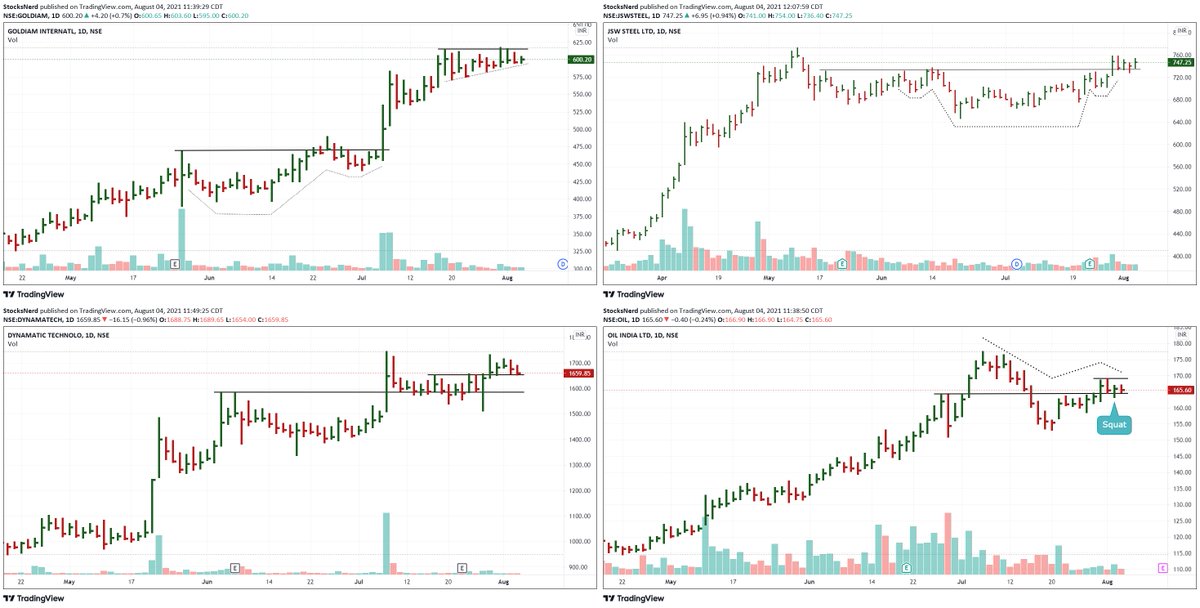
1) Choose stocks in Stage 2 with RS > 75
2) Identify these setups - Cup with Handle, High Tight Flag, Rectangle, VCP, Squat, Low Cheat, 3-C.
2) Wait for the significant contraction in daily range, volatility & Volume.
How do u screen stocks???
— \u2206bhishek Jain (@AbhishekTMM) August 6, 2021
I highly recommend this book to all the beginners in stock market.
Sir, if not wrong you taught MACD -H in your elearn webinar also? From where you have learned it?
— Prakhar (@Indiantrader101) August 23, 2021
* Trading for a Living
For my trading strategy, 13-day & 22-day EMAs are more suitable.
If SmallCap dips below these MAs & they get into the bearish sync, I get cautious & reduce my position size.
Sir as you follow the smallcap index,do you take full positions when it\u2019s trading below its key moving averages or wait for some confirmation? pic.twitter.com/ph6HTJ9rbD
— Dhanesh Gianani (@dhanesh500) November 30, 2021
Signs are all over the place, you just needed to read them. https://t.co/17bwpa1psj
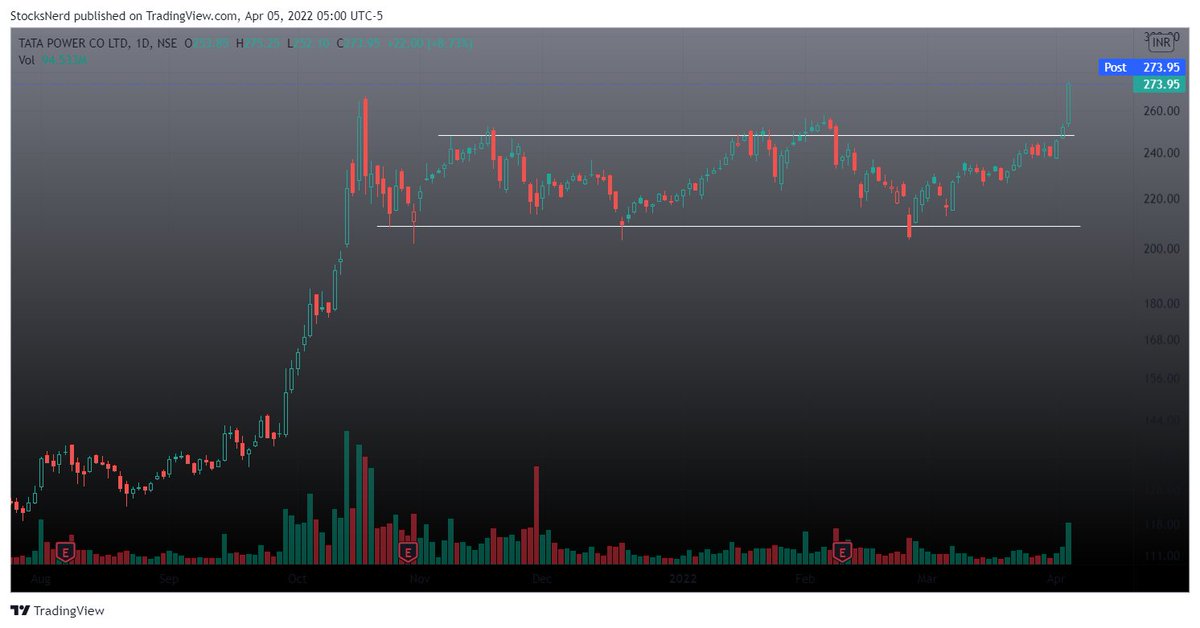
#TATAPOWER is consolidating nicely around 50 & 10-DMA.
— Ravi Sharma (@StocksNerd) April 1, 2022
3 Pocket Pivot days in the last couple of weeks are signaling the interest of buyers.
4 months long base.
Steady growth in Earnings & Sales in the last 3 quarters.
Relative Strength: 77
Group Rank: 22 pic.twitter.com/2WFeUGiV1z
I have made some minor tweakings to this timing model since this tweet but it still will give you an idea and primer 👇
Trading 101 with SmallCap Index
— Ravi Sharma (@StocksNerd) August 20, 2019
1. Swing trades when bullish divergence in MACD-H forms
2. Breakout trades if Index closes above 22-Day high
3. Pullback/Pocket Pivot trades if Index consolidates constructively while13-EMA>22-EMA
4. Sell, go cash if Index breaches 10-Day low, NQA pic.twitter.com/u8VjXrU0Re