
https://t.co/JIO9Ou2NtQ
A small thread on intraday support resistance logics over time
The most common is Pivot , support and resistances calculated from the previous day's data
https://t.co/ILMjMay1zc
They can be calculated for daily, weekly, monthly etc.
https://t.co/JIO9Ou2NtQ
What struck me was that in each of the cases , we were using the OHLC and doing some maths with a multiplier/divider which WE/the trader thought fits the price action of the markets
Now the problem is, what has worked on the past set is on the past set. There is no guarantee that it will work in the future. As markets change, what do we do ?
A few lines of code on python can do this ( choosing some X period of backdata, identifying the best fit and applying them the next day).
Hence I started posting on twitter
More from Subhadip Nandy
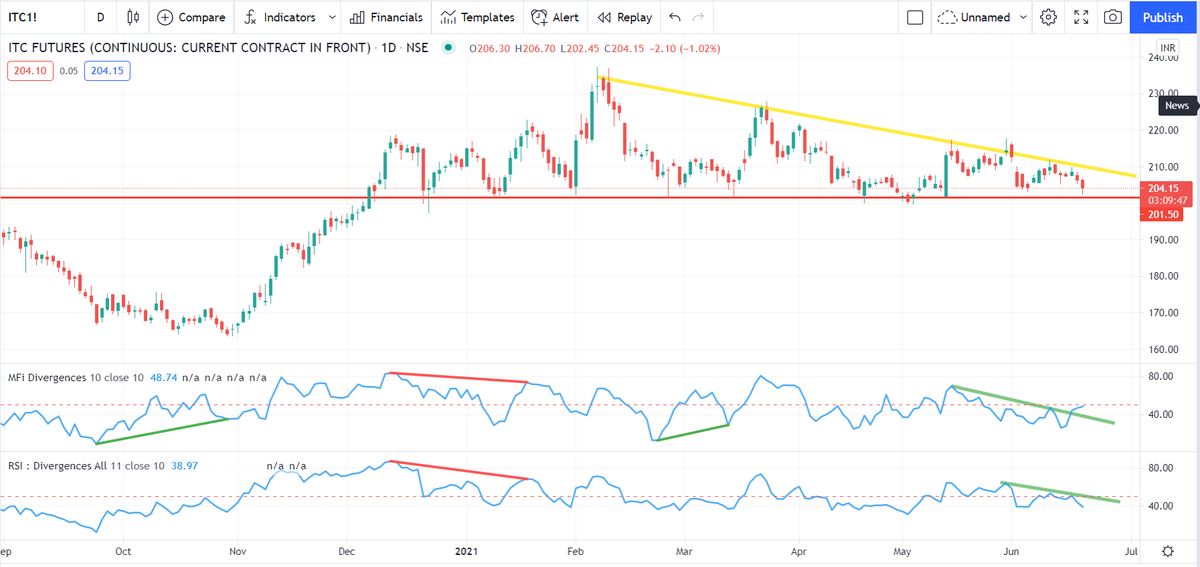


Rule 4 : If buying a naked option, always ensure that implied volatility is low. This can be understood from the level of IV vis a vis historical IV levels. Use IVR or IVP etc.
For a naked option to make money, it's better if IV rises or at least stays flat.
This is a thread I wrote on IV, IVR etc
For a naked option to make money, it's better if IV rises or at least stays flat.
Rule 3 : DO NOT run or trade everything that moves. Focus on a few stocks and master them. When a move comes, make the max out of that move.
— Subhadip Nandy (@SubhadipNandy16) October 14, 2021
Example : in this crazy mkt, I did not even trade TataMotors this week. Stayed focussed on ITC and it gave good returns https://t.co/41wkugZg1I
This is a thread I wrote on IV, IVR etc
IV - A thread
— Subhadip Nandy (@SubhadipNandy16) September 20, 2018
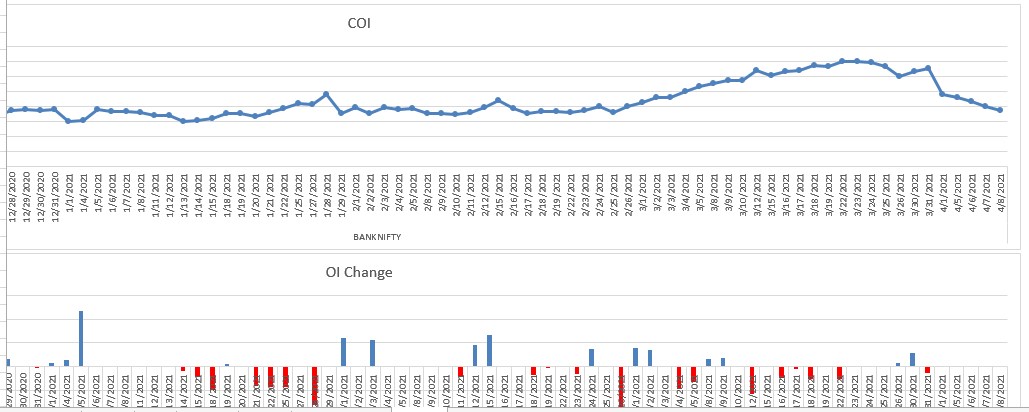
In financial mathematics, implied volatility of an option contract is
that value of the volatility of the underlying instrument which, when
input in an option pricing model ) will return a theoretical value equal to the current market price of the option (1/n)


More from Finance


Thread: P&F Super Pattern
An effective price pattern defined using properties of P&F charts.
#Superpattern #Pointandfigure #Definedge
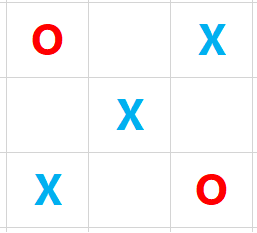
Point & Figure is an oldest charting method where price is plotted vertically, and the chart moves only when price moves. It is a different way of looking at the price, the objective box-value and reversal value offers advantage of identifying objective price patterns.
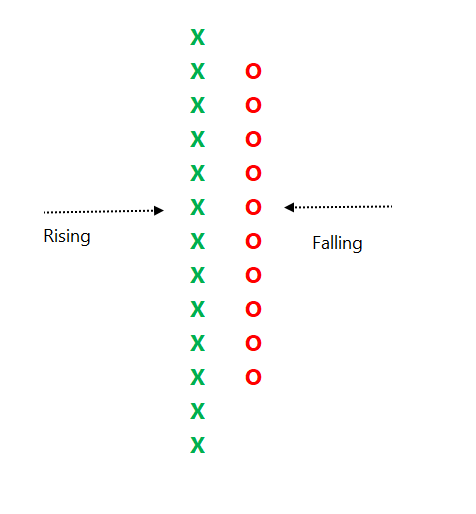
When price is moving up, it is plotted in a column of 'X'. When it is going down, it is plotted in a column of ‘O’. Normally, three-box reversal criteria is used to define the trend & reversal. Unlike a bar or candle, the P&F column can have multiple sessions in it.
Link to know more about the subject:
https://t.co/2xtLAVPBvm
See below chart. Price is in a strong uptrend, P&F chart would produce a long of column of 'X' with more number of boxes in it.
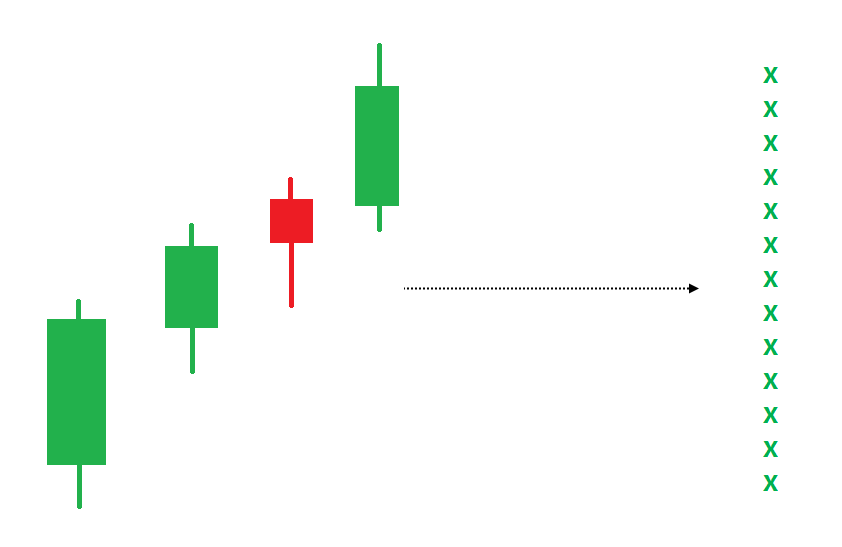
If such a trend is followed by some time bars without meaningful price correct, P&F chart would not move, and it will remain in column of 'X' in such a scenario.
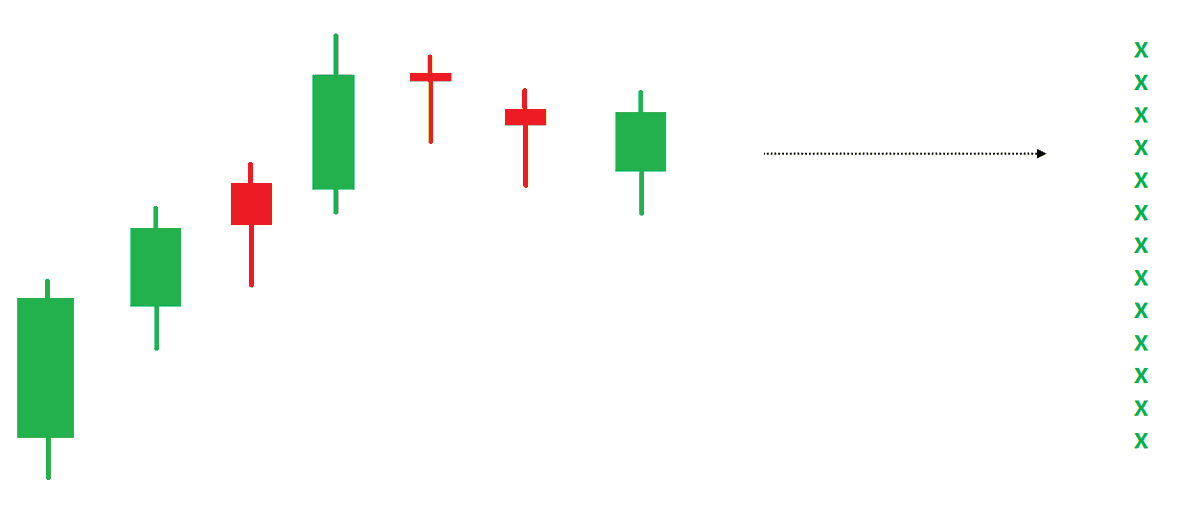
An effective price pattern defined using properties of P&F charts.
#Superpattern #Pointandfigure #Definedge
Point & Figure is an oldest charting method where price is plotted vertically, and the chart moves only when price moves. It is a different way of looking at the price, the objective box-value and reversal value offers advantage of identifying objective price patterns.
When price is moving up, it is plotted in a column of 'X'. When it is going down, it is plotted in a column of ‘O’. Normally, three-box reversal criteria is used to define the trend & reversal. Unlike a bar or candle, the P&F column can have multiple sessions in it.
Link to know more about the subject:
https://t.co/2xtLAVPBvm
See below chart. Price is in a strong uptrend, P&F chart would produce a long of column of 'X' with more number of boxes in it.
If such a trend is followed by some time bars without meaningful price correct, P&F chart would not move, and it will remain in column of 'X' in such a scenario.

The Dutch regulator and DNB as financial supervisor are a tough cookie to deal with. In essence they hyperregulate EU-rules into goldplated Dutch rules which go beyond what is prescribed in Europe.
All NL-customers at British banks may thus be kicked out on brexit.
Thread
/1
If we start with the capital requirements directive, it says attracting deposits is forbidden. In article 9.
https://t.co/RYl7SXligC

Now the translation of that rule into Dutch law is slightly expanded to not only prohibit attracting deposits, but to also prohibit, having those deposits under custody ('ter beschikking hebben').
That's not in EU law, but it is in our Dutch law.
https://t.co/PsbWfNY3PA

So if you wonder how this would work out for UK banks and Payment institutions servicing Dutch customers. Have a read at the technical explanation of DNB, the financial supervisor and their summarising table.
https://t.co/LL0fAnYkRJ
Passive servicing of Dutch is not allowed!

Any bank or PSP in the UK that continues to serve Dutch customers (as in retail customers, professional players are excepted) can thus be subject to fines and policing under Dutch law.
Meaning we not only have Accidental American issues in payments, but also Accidental Dutchies
All NL-customers at British banks may thus be kicked out on brexit.
Thread
/1
If we start with the capital requirements directive, it says attracting deposits is forbidden. In article 9.
https://t.co/RYl7SXligC
Now the translation of that rule into Dutch law is slightly expanded to not only prohibit attracting deposits, but to also prohibit, having those deposits under custody ('ter beschikking hebben').
That's not in EU law, but it is in our Dutch law.
https://t.co/PsbWfNY3PA
So if you wonder how this would work out for UK banks and Payment institutions servicing Dutch customers. Have a read at the technical explanation of DNB, the financial supervisor and their summarising table.
https://t.co/LL0fAnYkRJ
Passive servicing of Dutch is not allowed!
Any bank or PSP in the UK that continues to serve Dutch customers (as in retail customers, professional players are excepted) can thus be subject to fines and policing under Dutch law.
Meaning we not only have Accidental American issues in payments, but also Accidental Dutchies

Buffett's letters taught me more about investing than any business school ever could.
Even after investing for 14 years, I uncover new insights every time I reread his letters.
Recently, I reread his letters from 1977 to 2020 for a third time.
Here are my key insights:

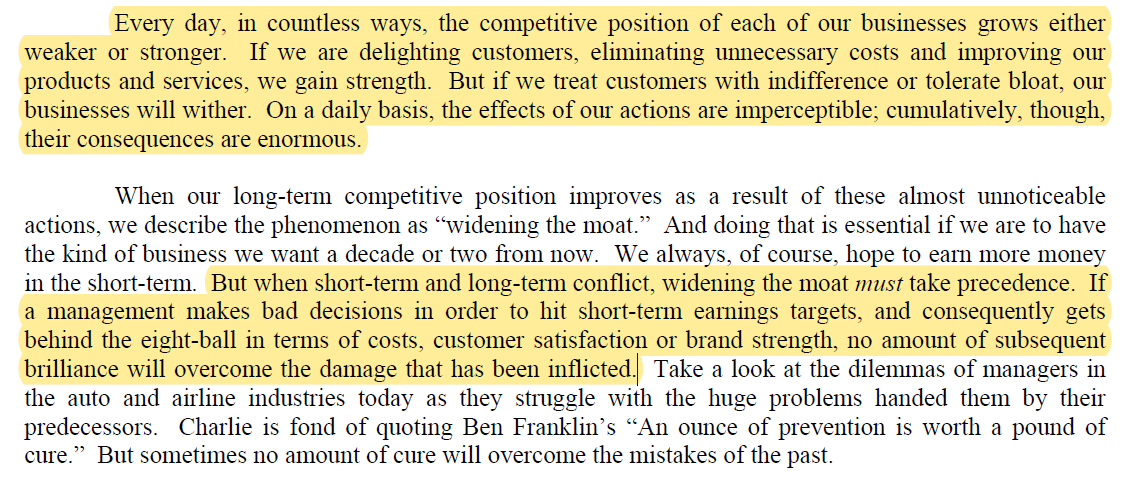
1. Moat is NEVER stagnant
A company's competitive position either grows stronger or weaker each day.
Widening the moat must always take precedence over short-term targets.
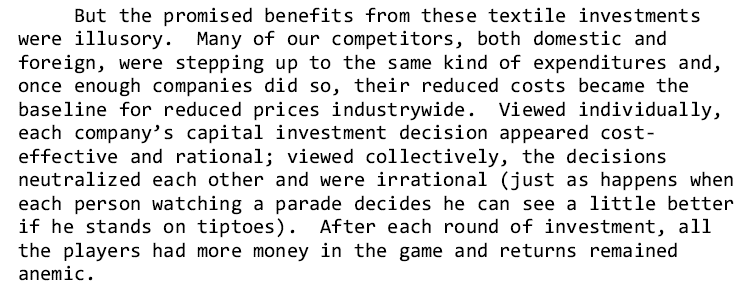
2. Commodity businesses
A business without moat will have its returns competed away.
Regardless of improvement, your competitors will quickly copy your advantage away.
Where returns on capital is dismal, reinvestment will only destroy value.
3. The flywheel effect
Buffett was preaching about the flywheel effect before it became cool.
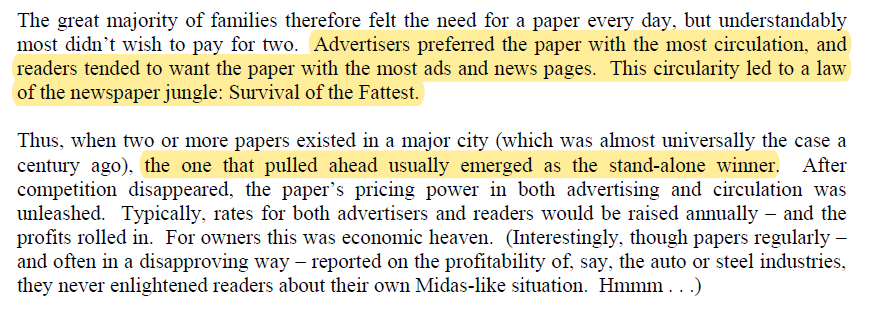
Back then, newspapers were similar to today's platform businesses like Amazon, Meta, and App Store.
More readers beget more advertisers beget more readers.
4. Operating leverage
Companies with high fixed costs and low variable costs will see earnings rise faster than revenue.
However, it cuts both ways.
It becomes a disaster when revenue is declining.
Check out my article on how operating leverage works: https://t.co/Nv747oBAK0

Even after investing for 14 years, I uncover new insights every time I reread his letters.
Recently, I reread his letters from 1977 to 2020 for a third time.
Here are my key insights:
1. Moat is NEVER stagnant
A company's competitive position either grows stronger or weaker each day.
Widening the moat must always take precedence over short-term targets.
2. Commodity businesses
A business without moat will have its returns competed away.
Regardless of improvement, your competitors will quickly copy your advantage away.
Where returns on capital is dismal, reinvestment will only destroy value.
3. The flywheel effect
Buffett was preaching about the flywheel effect before it became cool.
Back then, newspapers were similar to today's platform businesses like Amazon, Meta, and App Store.
More readers beget more advertisers beget more readers.
4. Operating leverage
Companies with high fixed costs and low variable costs will see earnings rise faster than revenue.
However, it cuts both ways.
It becomes a disaster when revenue is declining.
Check out my article on how operating leverage works: https://t.co/Nv747oBAK0

You May Also Like


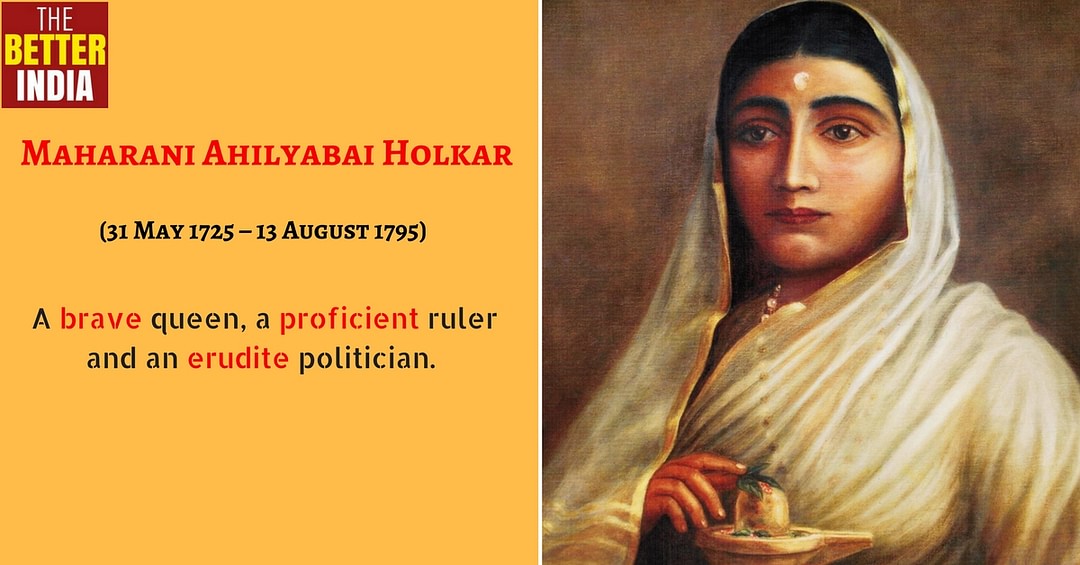







1. Project 1742 (EcoHealth/DTRA)
Risks of bat-borne zoonotic diseases in Western Asia
Duration: 24/10/2018-23 /10/2019
Funding: $71,500
@dgaytandzhieva
https://t.co/680CdD8uug
2. Bat Virus Database
Access to the database is limited only to those scientists participating in our ‘Bats and Coronaviruses’ project
Our intention is to eventually open up this database to the larger scientific community
https://t.co/mPn7b9HM48
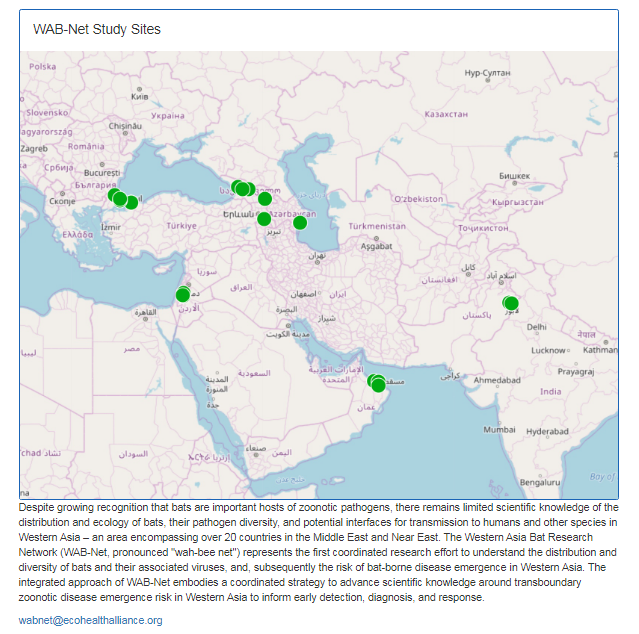
3. EcoHealth Alliance & DTRA Asking for Trouble
One Health research project focused on characterizing bat diversity, bat coronavirus diversity and the risk of bat-borne zoonotic disease emergence in the region.
https://t.co/u6aUeWBGEN

4. Phelps, Olival, Epstein, Karesh - EcoHealth/DTRA
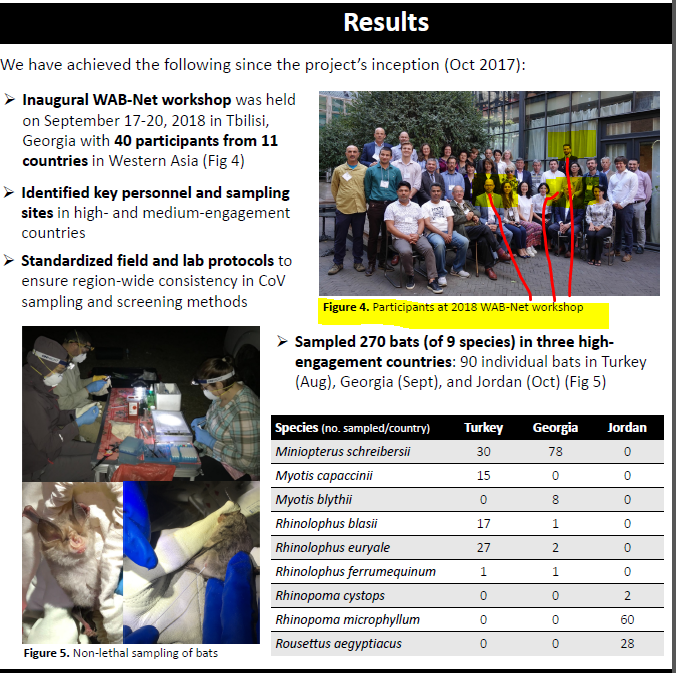
5, Methods and Expected Outcomes
(Unexpected Outcome = New Coronavirus Pandemic)

Risks of bat-borne zoonotic diseases in Western Asia
Duration: 24/10/2018-23 /10/2019
Funding: $71,500
@dgaytandzhieva
https://t.co/680CdD8uug
2. Bat Virus Database
Access to the database is limited only to those scientists participating in our ‘Bats and Coronaviruses’ project
Our intention is to eventually open up this database to the larger scientific community
https://t.co/mPn7b9HM48
3. EcoHealth Alliance & DTRA Asking for Trouble
One Health research project focused on characterizing bat diversity, bat coronavirus diversity and the risk of bat-borne zoonotic disease emergence in the region.
https://t.co/u6aUeWBGEN
4. Phelps, Olival, Epstein, Karesh - EcoHealth/DTRA
5, Methods and Expected Outcomes
(Unexpected Outcome = New Coronavirus Pandemic)