
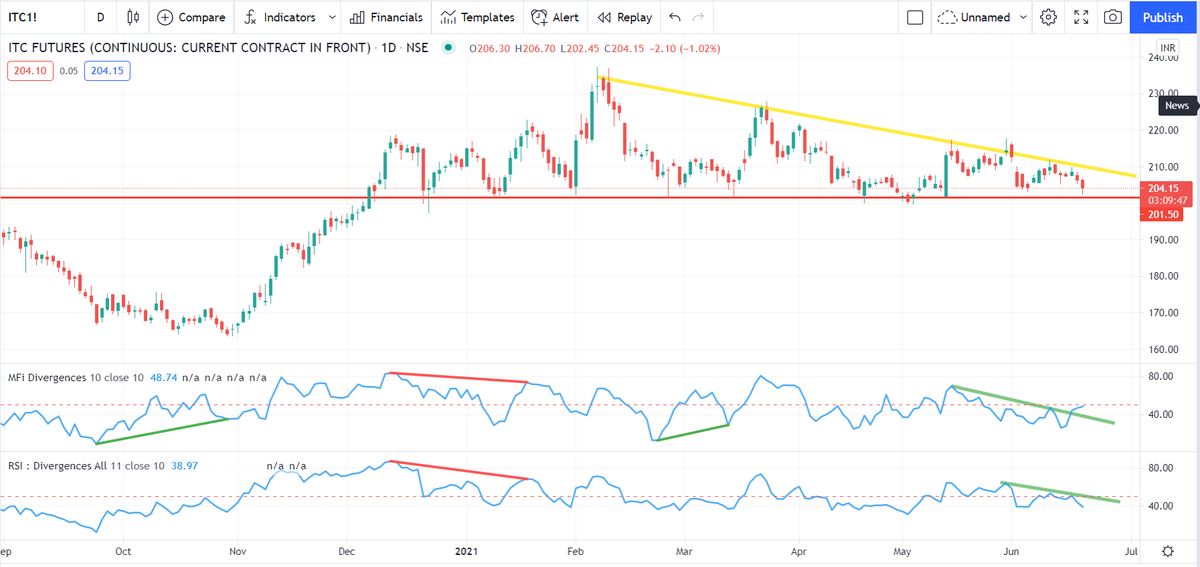
Since lot of discussions on ITC, had a simple look at the chart. With each passing day, the probability of a large breakout increases. Watch the behaviour of MFI, but wait for prices to trade above the trendline with volumes
More from Subhadip Nandy
My presentation on Money Management was based on a lot of sources as I mentioned. For traders interested on those sources , here they are
#OptimalF
Portfolio Management Formulas: Mathematical Trading Methods for the Futures, Options, and Stock Markets by Ralph Vince
The Mathematics of Money Management: Risk Analysis Techniques for Traders by Ralph Vince
#SecureF
#FixedRatio
The Trading Game: Playing by the Numbers to Make Millions by Ryan Jones
https://t.co/U0c65EbEog.


Time I retweeted this 😃
IV - A thread
— Subhadip Nandy (@SubhadipNandy16) September 20, 2018
In financial mathematics, implied volatility of an option contract is
that value of the volatility of the underlying instrument which, when
input in an option pricing model ) will return a theoretical value equal to the current market price of the option (1/n)
More from Itc


You May Also Like


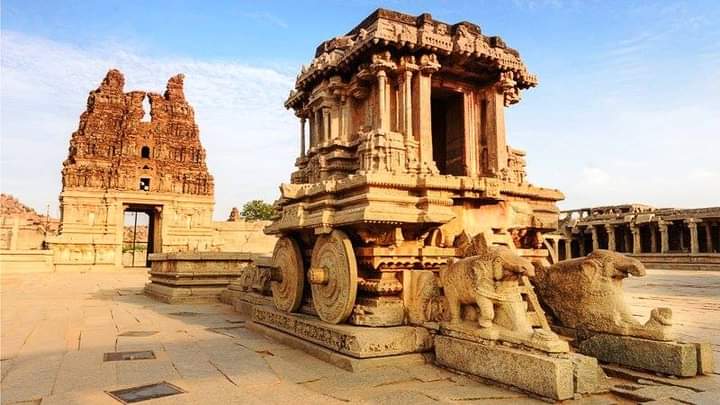

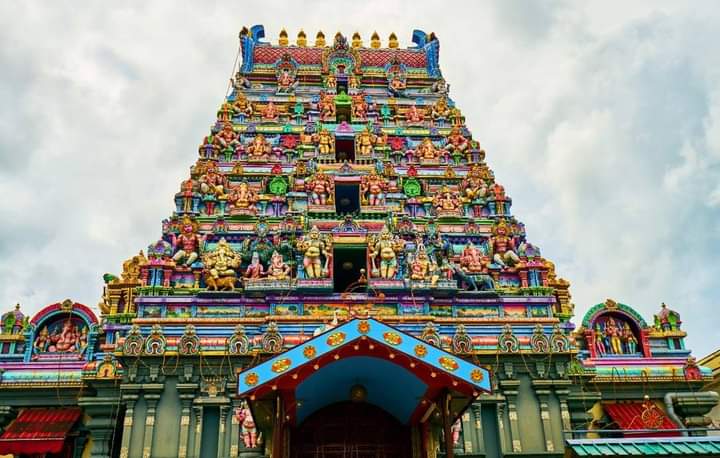
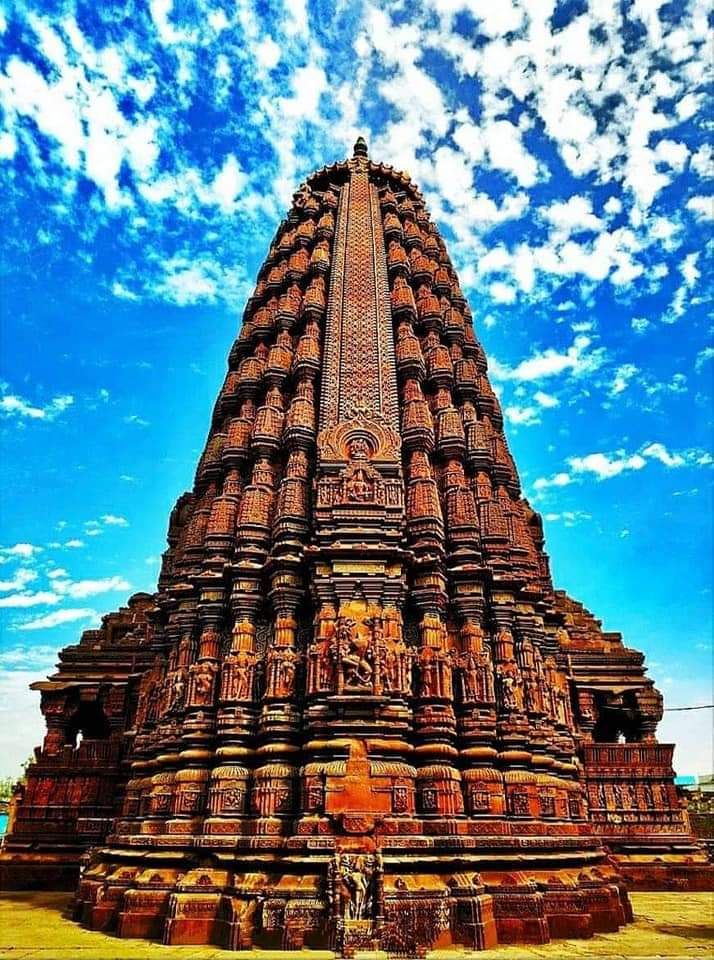


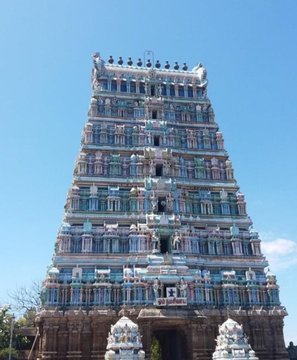
Margatha Natarajar murthi - Uthirakosamangai temple near Ramanathapuram,TN
#ArudraDarisanam
Unique Natarajar made of emerlad is abt 6 feet tall.
It is always covered with sandal paste.Only on Thriuvadhirai Star in month Margazhi-Nataraja can be worshipped without sandal paste.
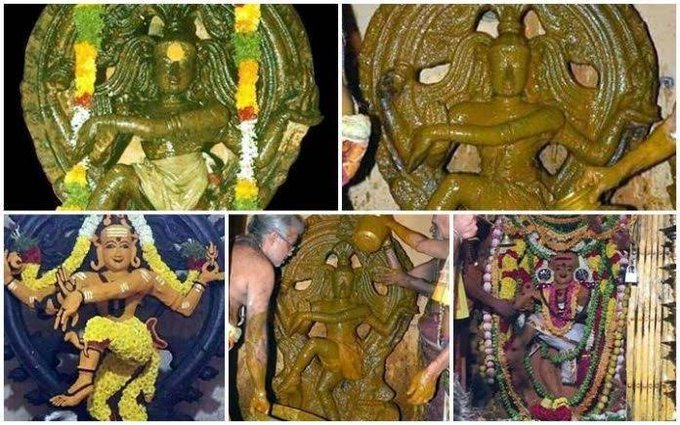
After removing the sandal paste,day long rituals & various abhishekam will be https://t.co/e1Ye8DrNWb day Maragatha Nataraja sannandhi will be closed after anointing the murthi with fresh sandal paste.Maragatha Natarajar is covered with sandal paste throughout the year
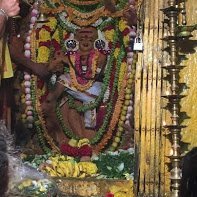
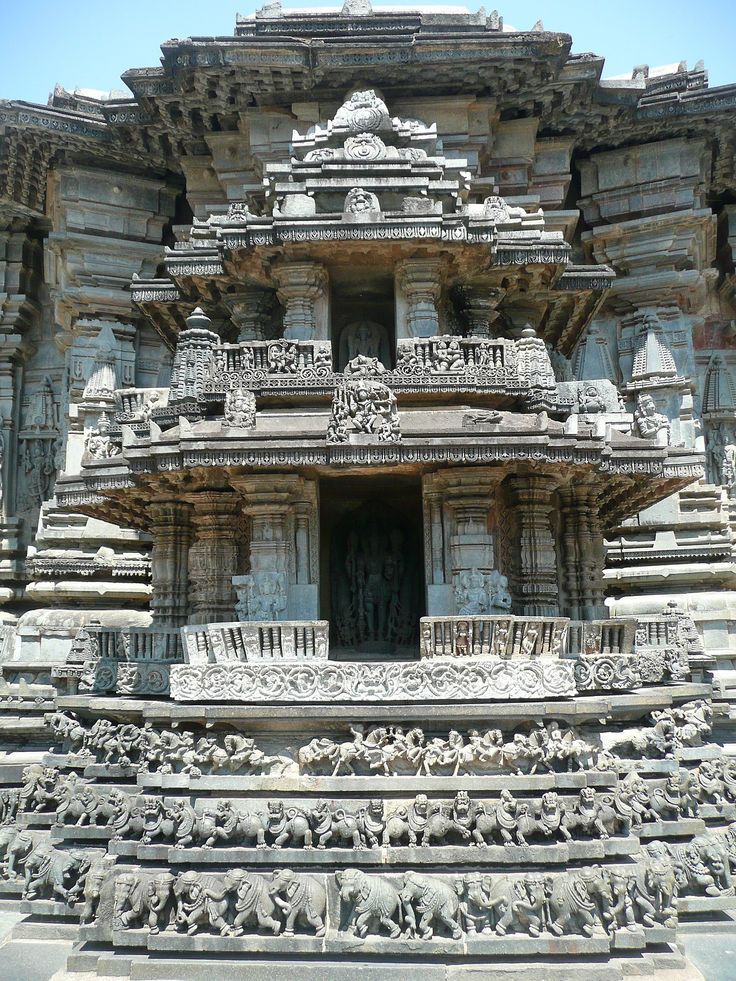
as Emerald has scientific property of its molecules getting disturbed when exposed to light/water/sound.This is an ancient Shiva temple considered to be 3000 years old -believed to be where Bhagwan Shiva gave Veda gyaana to Parvati Devi.This temple has some stunning sculptures.
#ArudraDarisanam
Unique Natarajar made of emerlad is abt 6 feet tall.
It is always covered with sandal paste.Only on Thriuvadhirai Star in month Margazhi-Nataraja can be worshipped without sandal paste.
After removing the sandal paste,day long rituals & various abhishekam will be https://t.co/e1Ye8DrNWb day Maragatha Nataraja sannandhi will be closed after anointing the murthi with fresh sandal paste.Maragatha Natarajar is covered with sandal paste throughout the year
as Emerald has scientific property of its molecules getting disturbed when exposed to light/water/sound.This is an ancient Shiva temple considered to be 3000 years old -believed to be where Bhagwan Shiva gave Veda gyaana to Parvati Devi.This temple has some stunning sculptures.
