My presentation on Money Management was based on a lot of sources as I mentioned. For traders interested on those sources , here they are

#OptimalF
Portfolio Management Formulas: Mathematical Trading Methods for the Futures, Options, and Stock Markets by Ralph Vince

The Mathematics of Money Management: Risk Analysis Techniques for Traders by Ralph Vince
#SecureF

https://t.co/xfUMdMA7KX
#FixedRatio

The Trading Game: Playing by the Numbers to Make Millions by Ryan Jones
https://t.co/U0c65EbEog.
https://t.co/dNbuwBjUAy.
https://t.co/lrFiKCjTz5
https://t.co/4vibzHmi3U
https://t.co/OltOwb1WiP
As I said at the end of the presentation, all material is in public domain and I have freely drawn from these resources

More from Subhadip Nandy

The most important question now on the mind of all analysts and traders. Is this a bear market rally or is this the start of a bull move. Retweeting this as I will need a few tweets to explain my view


Everyone knows the HH-HL or LH-LL as per Dow theory. This can be a bit confusing on how one marks the Highs and Lows. Long back, I picked up this trick from one of the neo-Dow theorists on what to do in scenarios like this

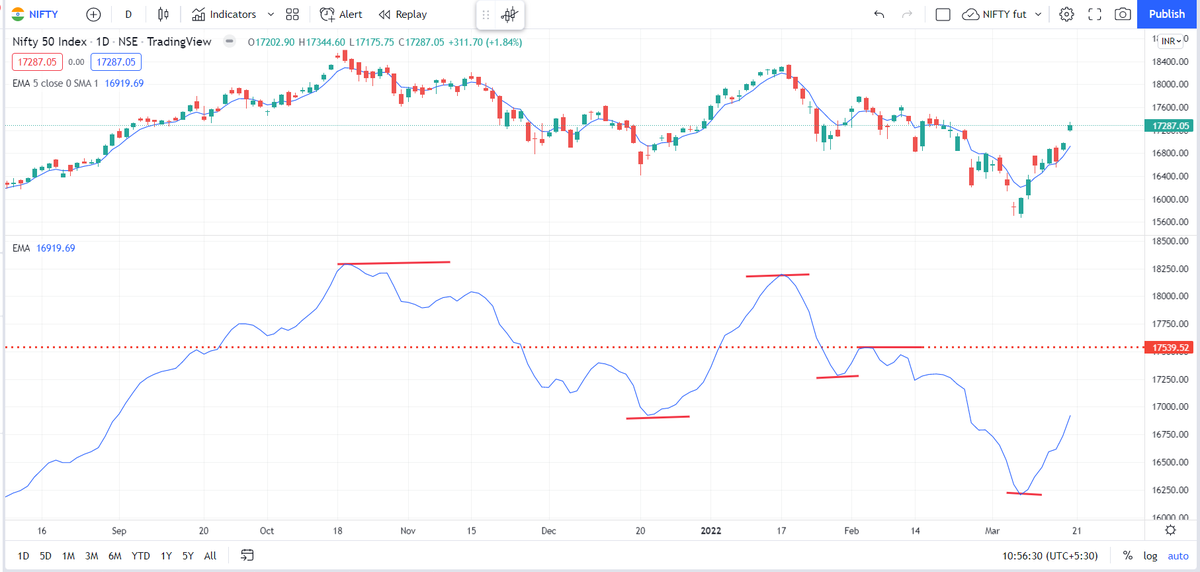
Simply plot a 5 period exponential moving average on a different panel. A 5-EMA simply shows you a running weekly perspective and kind of smoothens the price where a single spike high/low is not of that much importance

You will see this 5-ema also making HH.HL.LH.LL. So now, rather than focusing on the highs/lows on the charts, focusing on highs/lows on the 5-ema gives a cleaner perspective

As per this charts, unless the 5-ema now closes above 17540 ( the ema, not Nifty price) I will not play this as a bull market. I will deal with this market as a counter move against the major bear trend
This question might have rose in your mind too, that why VIX was lower than yesterday despite the huge selloff today.
This is what I think happens . A thread.


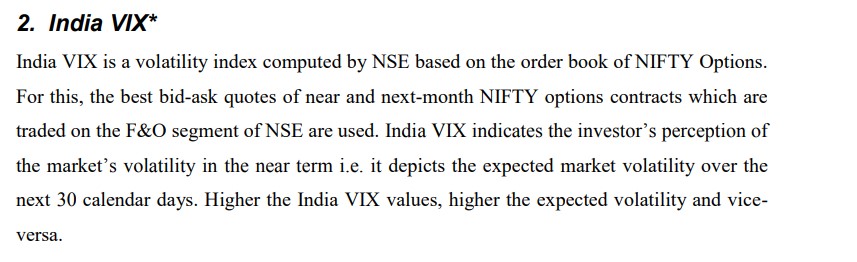
What is VIX ?
https://t.co/VOkAwGRsHL


What is IV ( implied volatility ) ?

Now my explanations. IV is simply demand and supply. IV is back calculated from option prices and not given by the BSM model. When demand for options ( by buyers) are high, IVs will be high. When supply of options ( by sellers) are high, IV will be low.

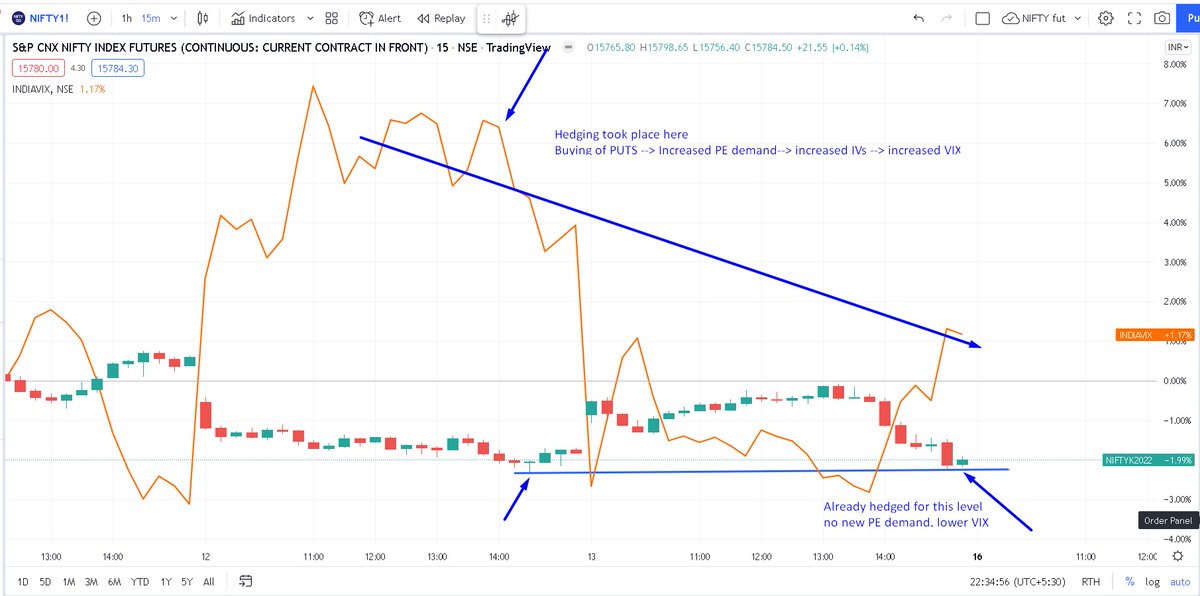
Now look at this chart. Nifty fut and VIX are plotted together ( red line is the VIX). Yesterday's massive breakdown forced traders to hedge their positions by buying puts ( could be cash holdings, could be future longs, could be sold puts). This excess demand spiked up IVs /VIX

You May Also Like

"I really want to break into Product Management"

make products.

"If only someone would tell me how I can get a startup to notice me."

Make Products.

"I guess it's impossible and I'll never break into the industry."

MAKE PRODUCTS.

Courtesy of @edbrisson's wonderful thread on breaking into comics –
https://t.co/TgNblNSCBj – here is why the same applies to Product Management, too.


There is no better way of learning the craft of product, or proving your potential to employers, than just doing it.

You do not need anybody's permission. We don't have diplomas, nor doctorates. We can barely agree on a single standard of what a Product Manager is supposed to do.

But – there is at least one blindingly obvious industry consensus – a Product Manager makes Products.

And they don't need to be kept at the exact right temperature, given endless resource, or carefully protected in order to do this.

They find their own way.