On a bullish Trend Ratio if Balance breaks, expect all longs to be trapped . Can short with stop above upper breakout figure. And vice versa
Along with the levels, there is Trend Ratio.
Near 1 or below is bearish, near 2 or above is bullish
( this as per last day's closing).
If Trend Ratio is bullish, expect support at Balance or breakout above Upper level will mean rally will continue.
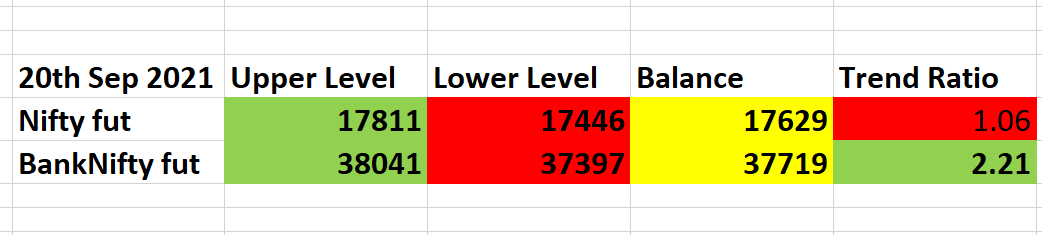
On a bullish Trend Ratio if Balance breaks, expect all longs to be trapped . Can short with stop above upper breakout figure. And vice versa
1. DO NOT play bearish is market above Balance
2. DO NOT play bullish is market below Balance
The Balance basically tells you which side is a bit trapped
Nifty fut : Has closed on Friday below the Balance for Monday. So if Nifty opens a little below, will go short with a stop above Balance. Below lower levels will short more
More from Subhadip Nandy
IV - A thread
In financial mathematics, implied volatility of an option contract is
that value of the volatility of the underlying instrument which, when
input in an option pricing model ) will return a theoretical value equal to the current market price of the option (1/n)
Implied volatility, a forward-looking and subjective measure, differs
from historical volatility because the latter is calculated from known
past returns of a security. .
https://t.co/iC5wVf7kvj (2/n)
To understand where Implied Volatility stands in terms of the underlying, implied volatility rank is used to understand its implied volatility from a one year high and low IV.
https://t.co/NFPOidRRcH
https://t.co/qNqinEqaKY
(3/n)
Options traders are always looking at the IV and IVR/IVP. For option
buyers, a low IV environment is best to initiate positions as the
subsequent rise in IV actually helps their positions . Even if the IV
remains flat, the position is not hurt by volatility (4/n)
Option sellers on the other hand are looking for high IV scenarios, where
the subsequent fall in IV ( known a vol crush , most often seen after
earnings/events) helps their positions. Here also, if the IV does not
rise, it does not hurt a seller's positions (5/n)
In financial mathematics, implied volatility of an option contract is
that value of the volatility of the underlying instrument which, when
input in an option pricing model ) will return a theoretical value equal to the current market price of the option (1/n)
Implied volatility, a forward-looking and subjective measure, differs
from historical volatility because the latter is calculated from known
past returns of a security. .
https://t.co/iC5wVf7kvj (2/n)
To understand where Implied Volatility stands in terms of the underlying, implied volatility rank is used to understand its implied volatility from a one year high and low IV.
https://t.co/NFPOidRRcH
https://t.co/qNqinEqaKY
(3/n)
Options traders are always looking at the IV and IVR/IVP. For option
buyers, a low IV environment is best to initiate positions as the
subsequent rise in IV actually helps their positions . Even if the IV
remains flat, the position is not hurt by volatility (4/n)
Option sellers on the other hand are looking for high IV scenarios, where
the subsequent fall in IV ( known a vol crush , most often seen after
earnings/events) helps their positions. Here also, if the IV does not
rise, it does not hurt a seller's positions (5/n)
Study this thread and then check the VIX charts and Nifty charts from 1st Oct 2018. There is a reason I am retweeting this now :)
1. IV > HV
— Subhadip Nandy (@SubhadipNandy16) October 5, 2018
2. High IVR
3. Sell strangles 2SD away
This is the crux of all complicated option selling strategies . Nothing so simple can work across all market conditions .