https://t.co/Vk1Ot8hK0l
Yearly cursed/nightmarish science articles thread. Will include articles from past years for completeness since old threads have been lost.

https://t.co/Vk1Ot8hK0l
https://t.co/8N3wWkRtSl
https://t.co/80CwxRsINP
The humanzee is both scientifically possible and morally defensible.
https://t.co/R925n7ieWz

https://t.co/TqLAZ4rYqr
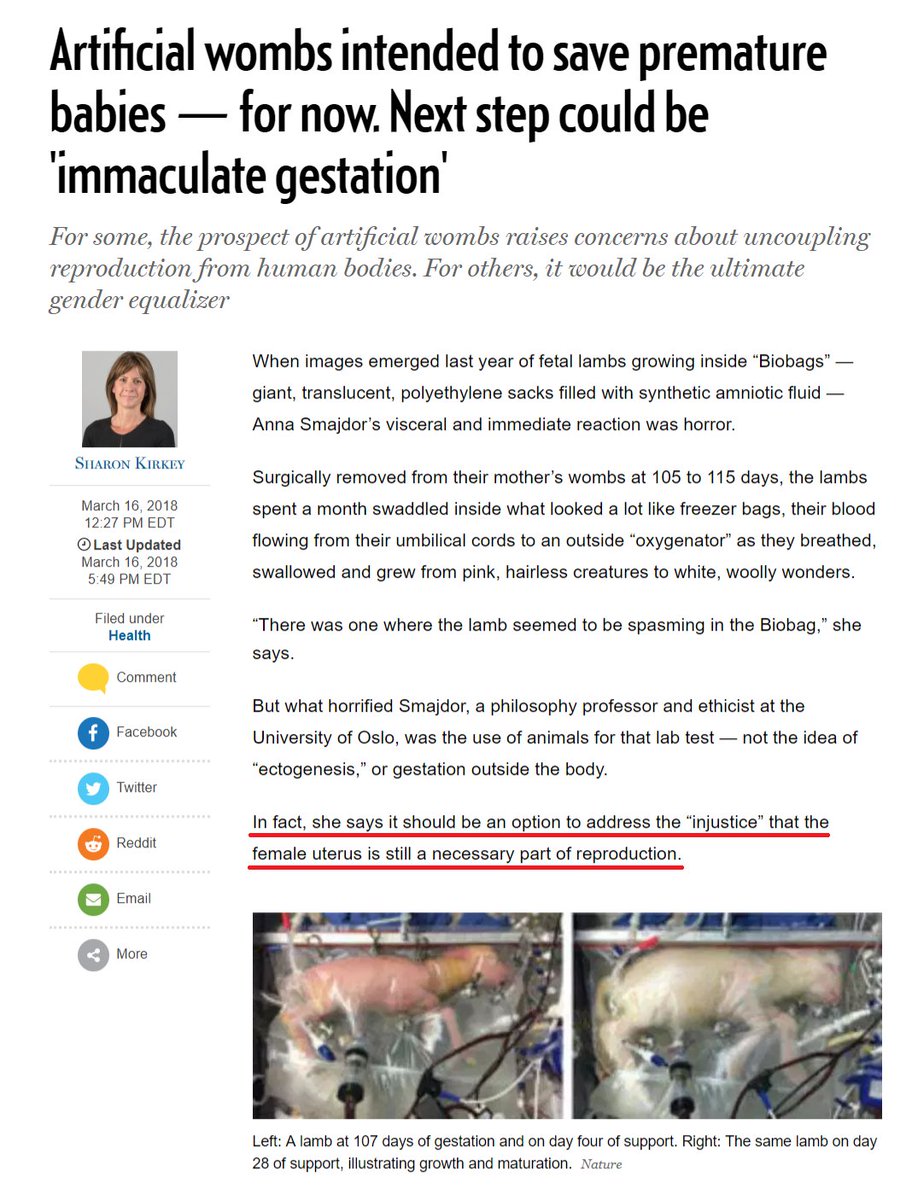
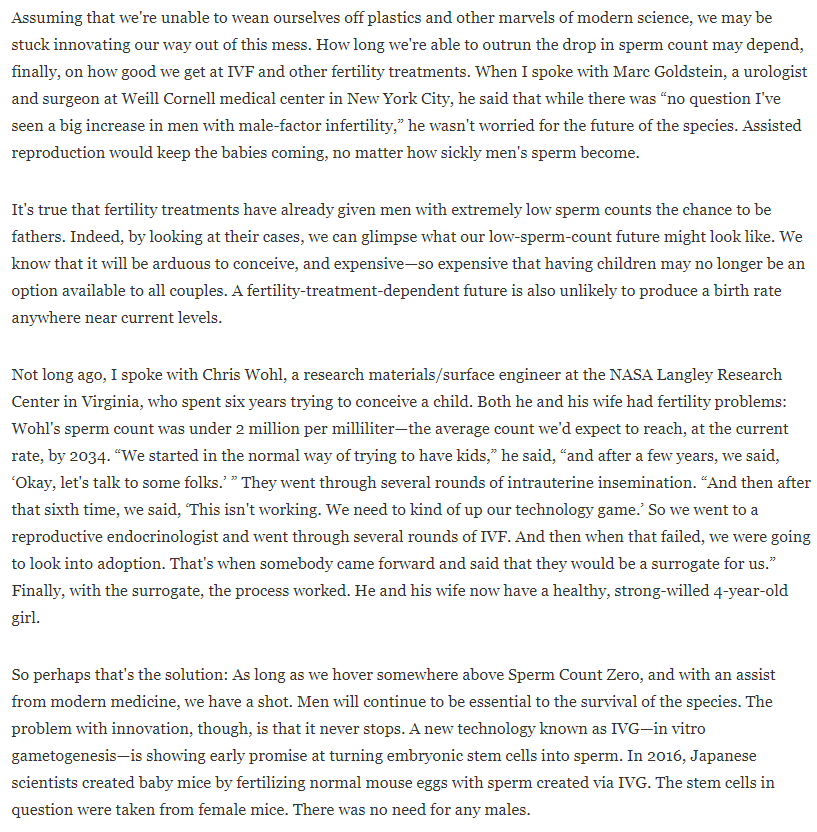
https://t.co/5JQuThCDob
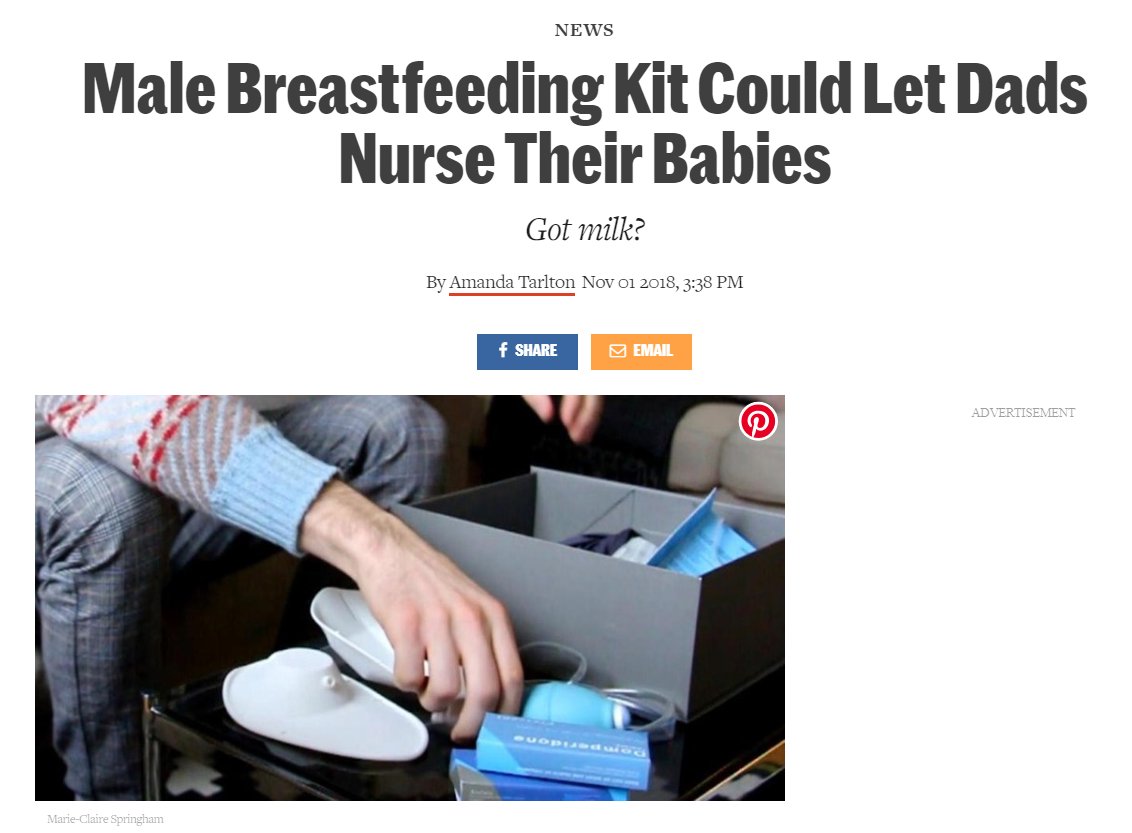
https://t.co/Gj8fT33JSU
https://t.co/GyhuoIrlWG
https://t.co/3xRJBJZg9t
https://t.co/dNX4mbTifk
https://t.co/Tbta3PBNag
https://t.co/umWSLnfekV
https://t.co/UDzTzCVHDb
https://t.co/rAWZivAXdP
https://t.co/UWyG3BLkL6
More from Science


"The new answer to a 77-year-old problem"
😭
https://t.co/hm9NoaU4nr
https://t.co/8fKDiKjSWc
https://t.co/jkaicC1F2x
https://t.co/PpxWT4Jef4
😭
The new answer to a 77-year-old problem in data analysis, published today in @naturemethods. Instead of significance tests, use estimation graphics. Our software suite DABEST makes it easy for everyone to visualize effect sizes.https://t.co/UzwXJ7EUC5 pic.twitter.com/VtxyY0xaRM
— Adam Claridge-Chang (@adamcchang) June 19, 2019
https://t.co/hm9NoaU4nr
Open letter to journal editors: dynamite plots must die. Dynamite plots, also known as bar and line graphs, hide important information. Editors should require authors to show readers the data and avoid these plots. https://t.co/0GNKEIUCJL pic.twitter.com/OS9ytEFRZN
— Rafael Irizarry (@rafalab) February 22, 2019
https://t.co/8fKDiKjSWc
Couldn't find D3 code for grouped horisontal box plots that show data points so I made this @mbostock @thisisalfie https://t.co/cQjDPhyZdw pic.twitter.com/y6RNmDB2p3
— Ulrik Lyngs (@ulyngs) June 28, 2017
https://t.co/jkaicC1F2x
made a pkg for pirate plots in ggplot: add any of points/means/bars/CIs/violins \u2013 better than ye olde bar/box plotshttps://t.co/Z2m2kW3hsl pic.twitter.com/npAirPQexM
— Mika Braginsky (@mbraginsky) September 28, 2017
https://t.co/PpxWT4Jef4
See the new #PowerBI visual awesomeness for data points & sources, box-&-whisker plots! https://t.co/dOmgoxWfDE pic.twitter.com/HAUOAMJEJW
— Microsoft Power BI (@MSPowerBI) February 1, 2016


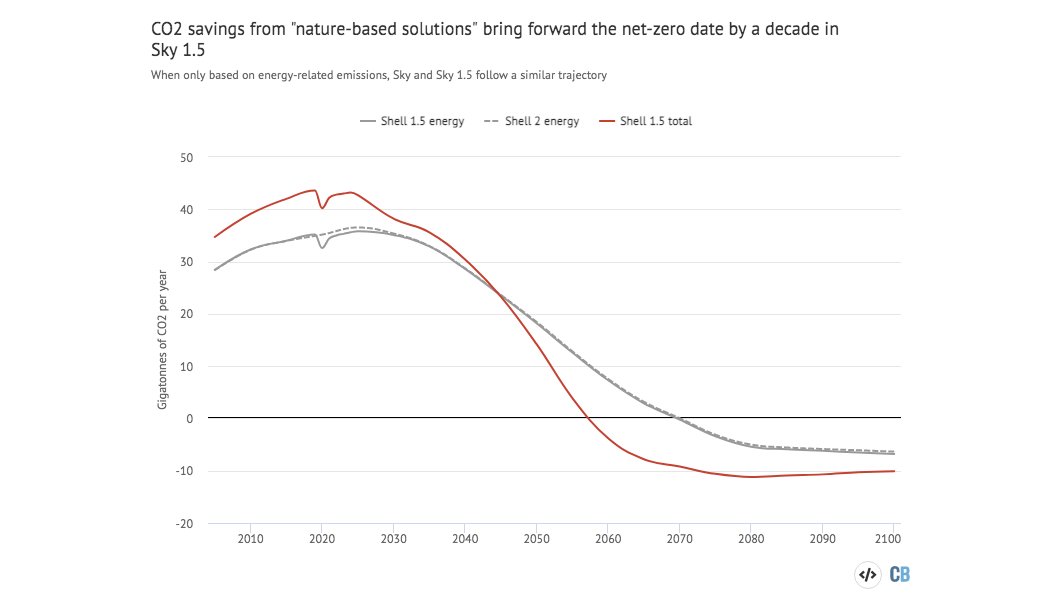
I took a look at Shell's first ever 1.5C scenario and found that it is... remarkably similar to its “well-below 2C” scenario.
Oil, gas, coal, solar.... all basically unchanged.
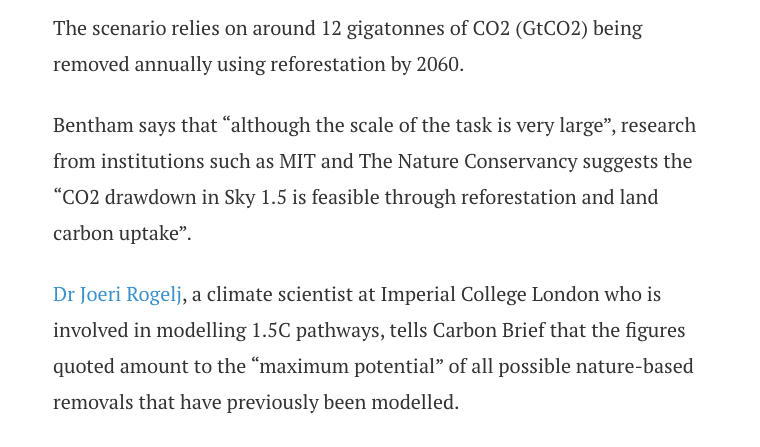
The key difference: A new forest the size of Brazil to suck up the extra CO2.
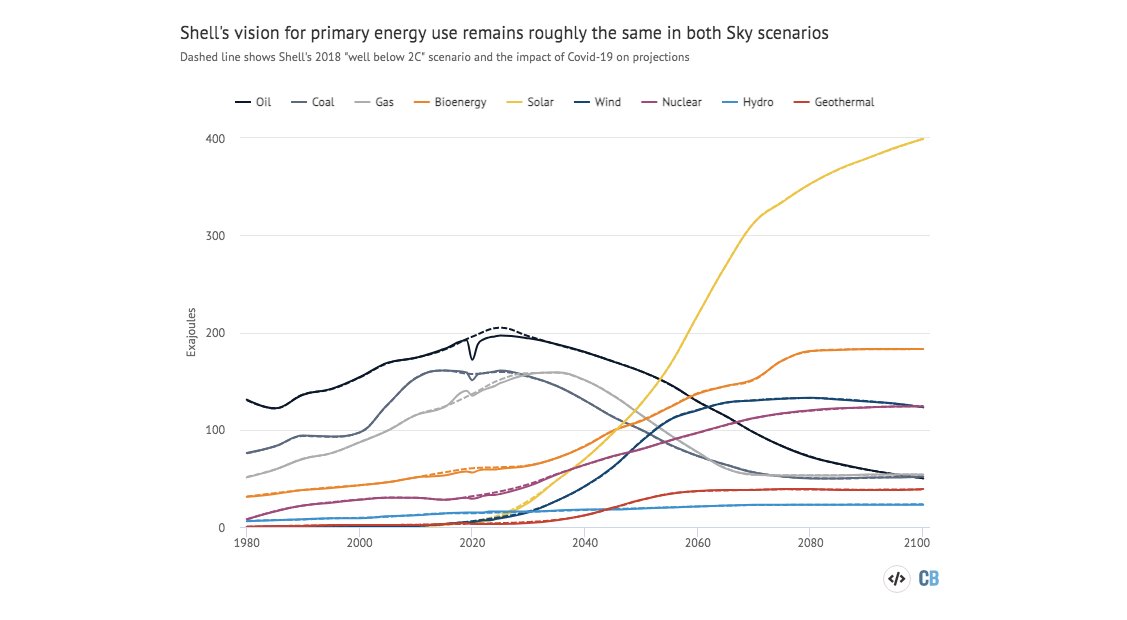
Including "nature-based solutions" in the outlook brings forward the date for net-zero emissions to 2058.
Without them their pathway for CO2 emissions is the same as the previous one.
(It's also towards the higher end of 1.5C emissions pathways.)
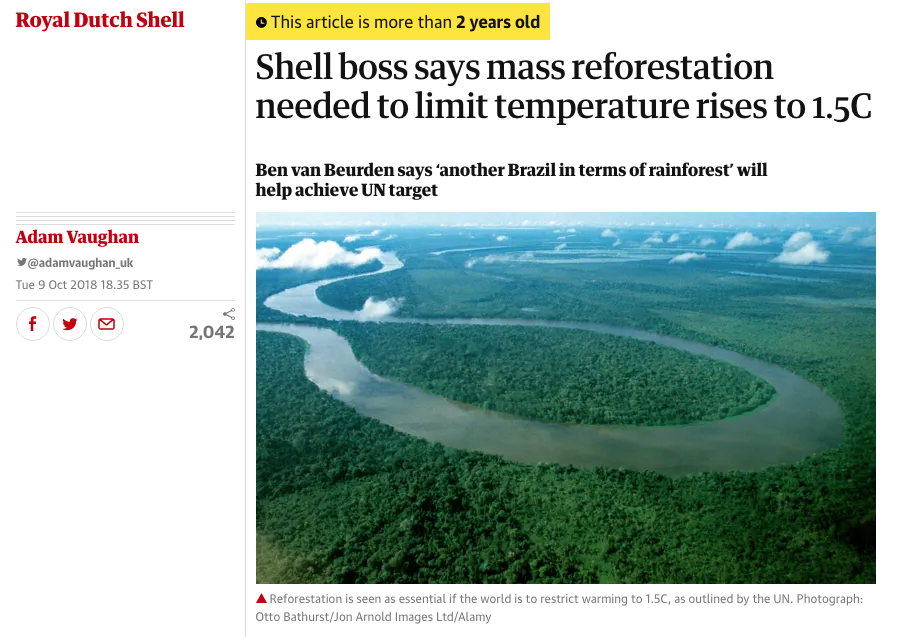
The "Brazil-sized" forest idea isn't actually new, it has been kicking around for a couple of years.
It was referenced in the "well-below 2C" scenario although not formally included in it, and Shell's CEO has been framing it as the only viable way of getting to 1.5C.
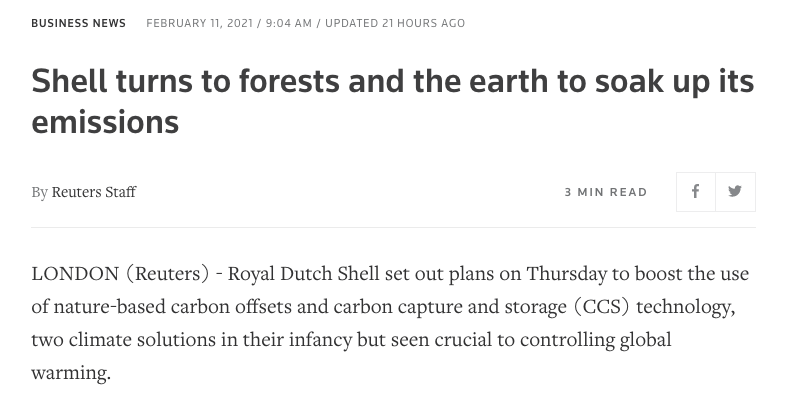
Fine, but who is going to plant all those trees? Well... Shell says it will plant some of them.
Only yesterday Shell said forests were a key part of its net-zero strategy.
Not everyone is convinced though
https://t.co/RaJm7tOHxb
Given that Shell's 1.5C scenario also sees a big scaling up of bioenergy, the question remains: where are all those trees and bioenergy crops going to go?
Oil, gas, coal, solar.... all basically unchanged.
The key difference: A new forest the size of Brazil to suck up the extra CO2.
Including "nature-based solutions" in the outlook brings forward the date for net-zero emissions to 2058.
Without them their pathway for CO2 emissions is the same as the previous one.
(It's also towards the higher end of 1.5C emissions pathways.)
The "Brazil-sized" forest idea isn't actually new, it has been kicking around for a couple of years.
It was referenced in the "well-below 2C" scenario although not formally included in it, and Shell's CEO has been framing it as the only viable way of getting to 1.5C.
Fine, but who is going to plant all those trees? Well... Shell says it will plant some of them.
Only yesterday Shell said forests were a key part of its net-zero strategy.
Not everyone is convinced though
https://t.co/RaJm7tOHxb
Shell plans to use forests to remove 120 Mt/yr of CO2 by 2030.
— Greg Muttitt (@FuelOnTheFire) February 12, 2021
Appropriate land for forestation is finite, and risks competition with food production and human rights of current land owners/users, esp Indigenous
Given that Shell's 1.5C scenario also sees a big scaling up of bioenergy, the question remains: where are all those trees and bioenergy crops going to go?