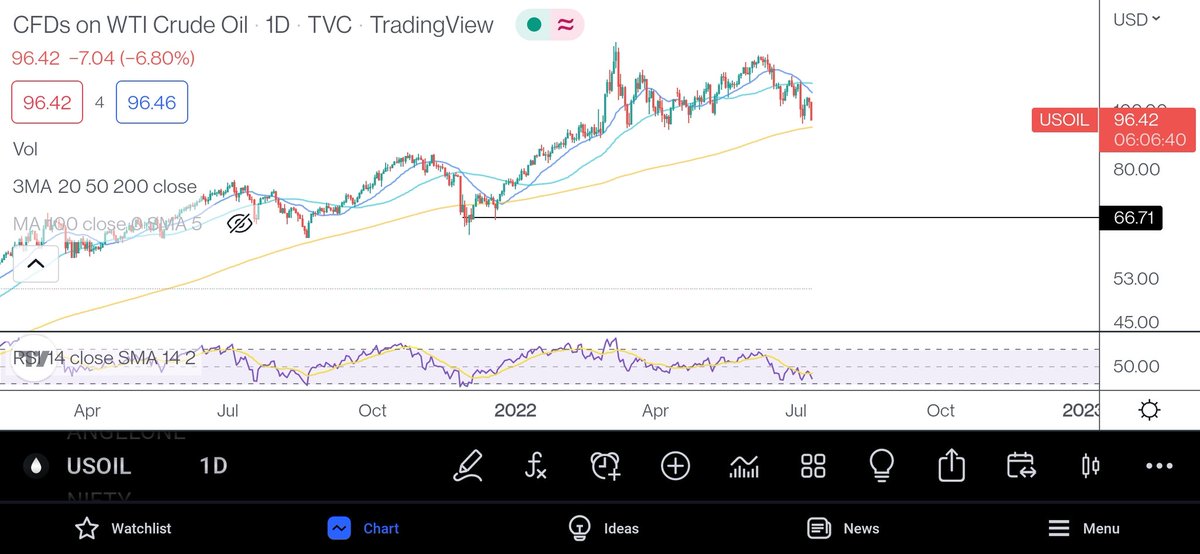
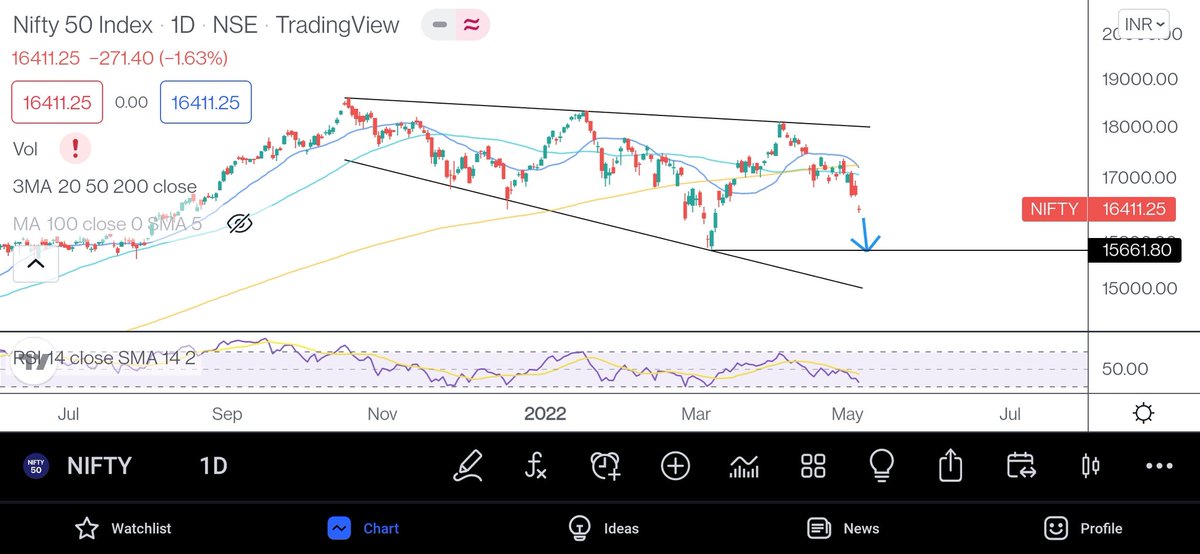
This doesn't even look like a correction now. Looks more like an impending crash. Marked base looks inevitable.
#Crude
More from Aakash Gangwar
#Nifty50 https://t.co/ajpEwosu3v
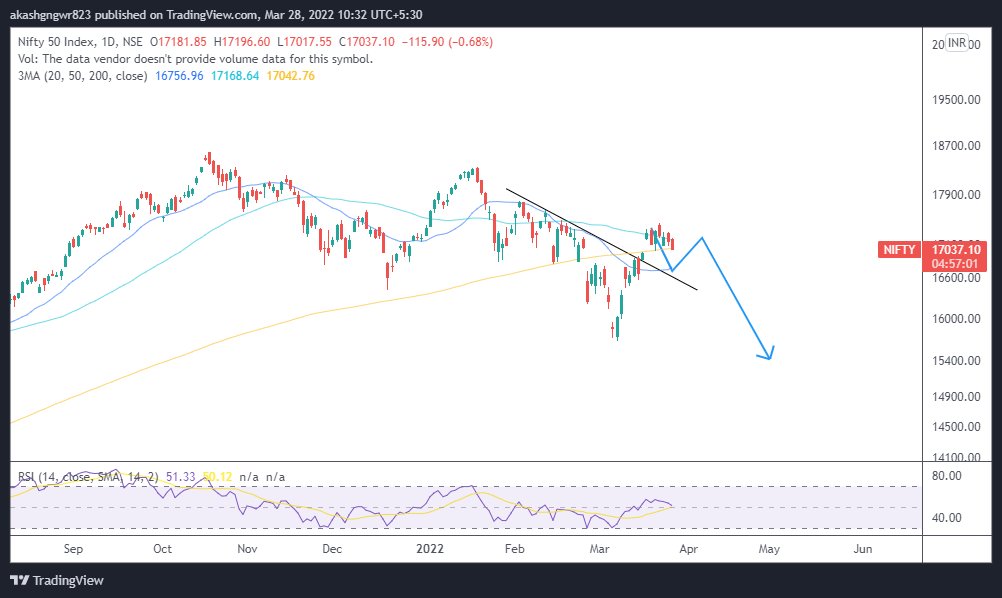
JK bhai let's have fake breakout in Nifty \U0001f61c
— Aakash Gangwar (@akashgngwr823) March 10, 2022
Not joking though, have a reason to anticipate that. https://t.co/idzSRIpWga pic.twitter.com/MNsTm3Mron
Do read it completely to understand the stance and the plan.
This thread will present a highly probable scenario of markets for the upcoming months. Will update the scenario too if there is a significant change in view in between.
— Aakash Gangwar (@akashgngwr823) May 15, 2022
1/n https://t.co/jfWOyEgZyd
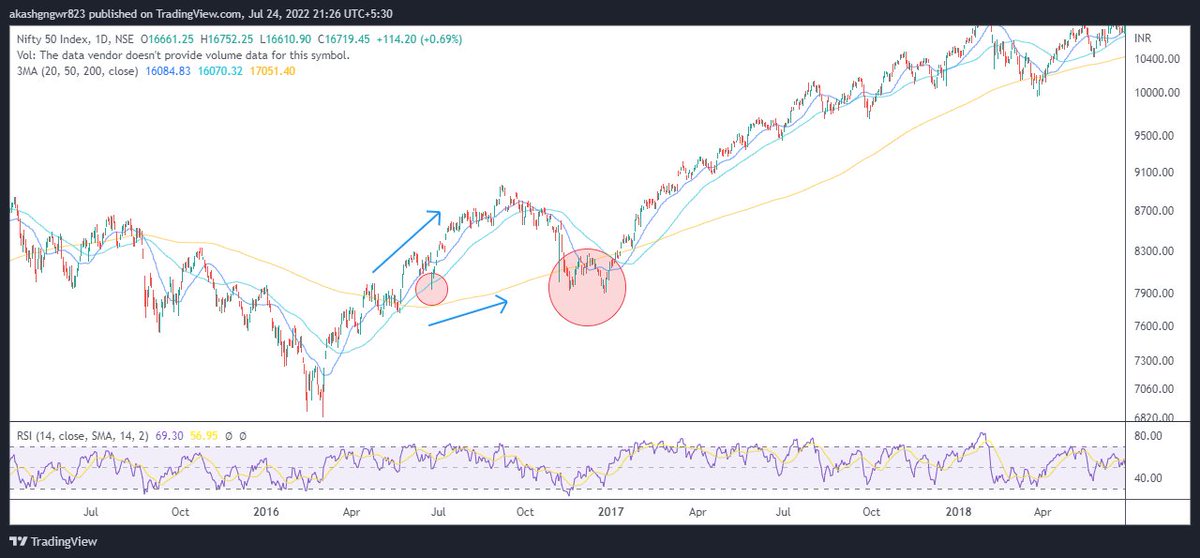
1. The moving average structure - Many traders just look at the 200 ma test or closing above/below it regardless of its slope. Let's look at all the interactions with 200 ma where price met it for the first time after the trend change but with 200 ma slope against it
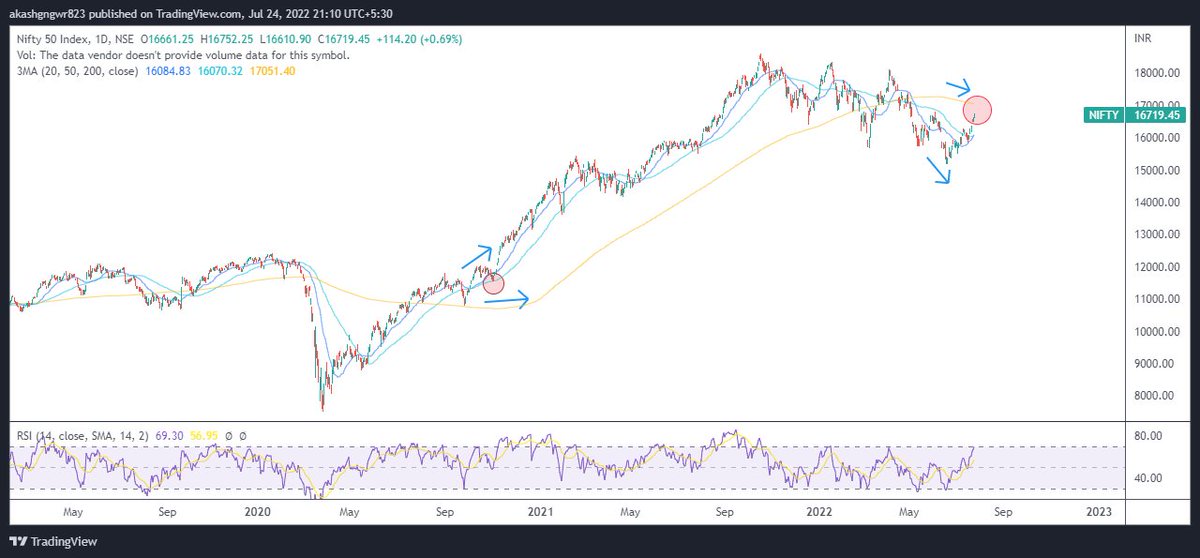
One can clearly sense that currently it is one of those scenarios only. I understand that I might get trolled for this, but an unbiased mind suggests that odds are highly against the bulls for making fresh investments.
But markets are good at giving surprises. What should be our stance if price kept on rising? Let's understand that through charts. The concept is still the same. Divergent 200 ma and price move results in 200 ma test atleast once which gives good investment opportunities.
2. Zig-Zag bear market- There are two types of fall in a bear market, the first one is vertical fall which usually ends with ending diagonals (falling wedges) and the second one is zig zag one which usually ends with parabolic down moves.
#CNXIT https://t.co/bJeKTMoCji
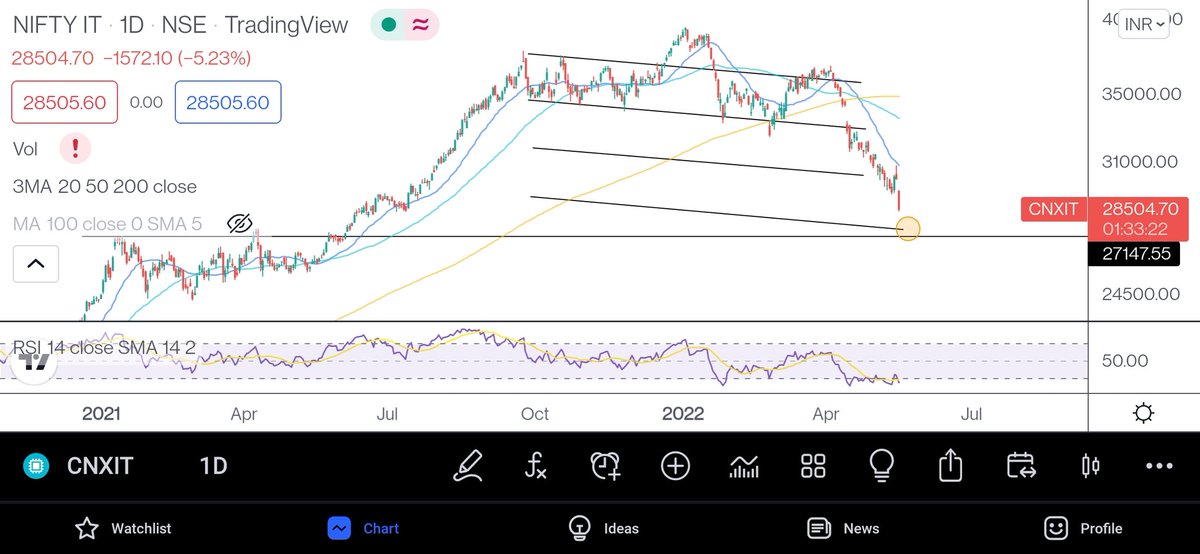
The current formation might look like a falling wedge, but the way moving averages are placed, it looks like a falling wedge which can lead to a parabolic downmove for the marked target. #CNXIT pic.twitter.com/GmXOI3HmUN
— Aakash Gangwar (@akashgngwr823) May 10, 2022
#CNXIT https://t.co/w3qedea7T6
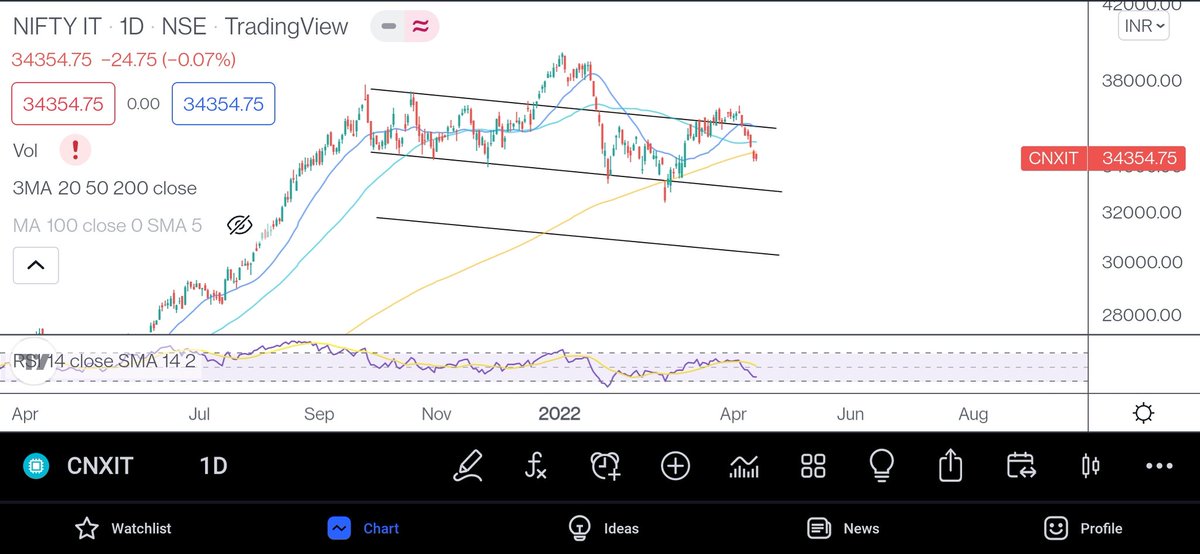
Almost there. Quick move. It can spend time over here before the next leg of fall. Let's see.#NIFTYIT https://t.co/GOB28HRvMp pic.twitter.com/6sNc7j8gEU
— Aakash Gangwar (@akashgngwr823) March 9, 2022
More from Crudeoillongterm


A quick thread 🧵
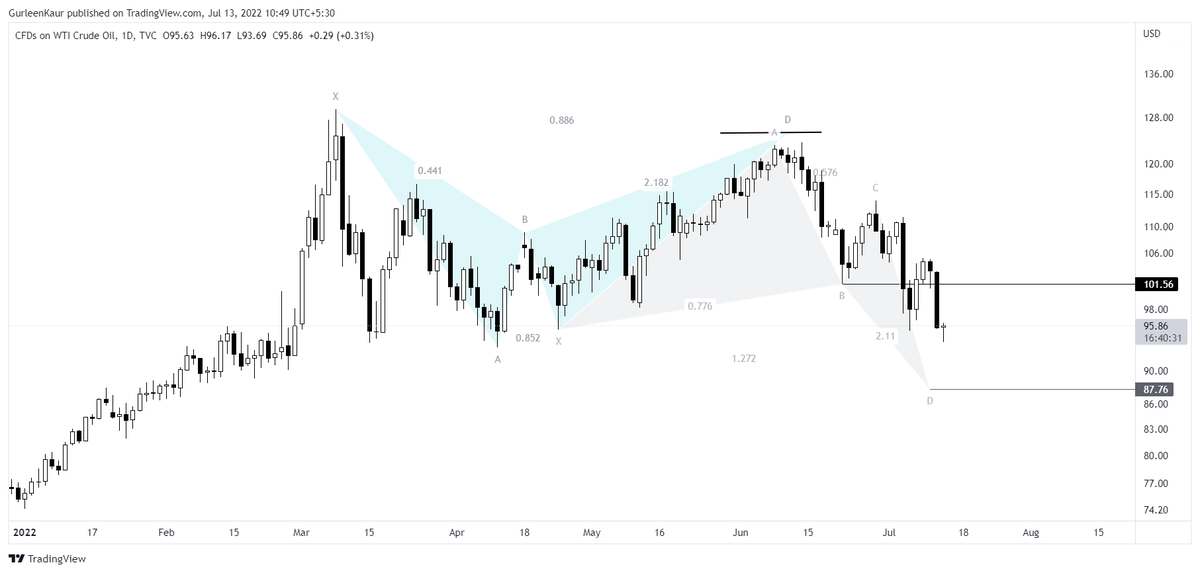
Daily TF
With the turn-around in price from the initial harmonic pattern, Consequent LH-LL's in place.
Below $101.56, We might catch sight of $87 followed by $78 https://t.co/nvzolftng6
$USOIL
— Gurleen (@GurleenKaur_19) June 6, 2022
With the inching up of reaction lows, the targets are placed at $125 and $134.
In a different case scenario, Let's not rule out the possibility- If the price continues to sustain above the level of $104, Might see a hit towards the level of $150 as well. #CrudeOil pic.twitter.com/p52TnRkBqC
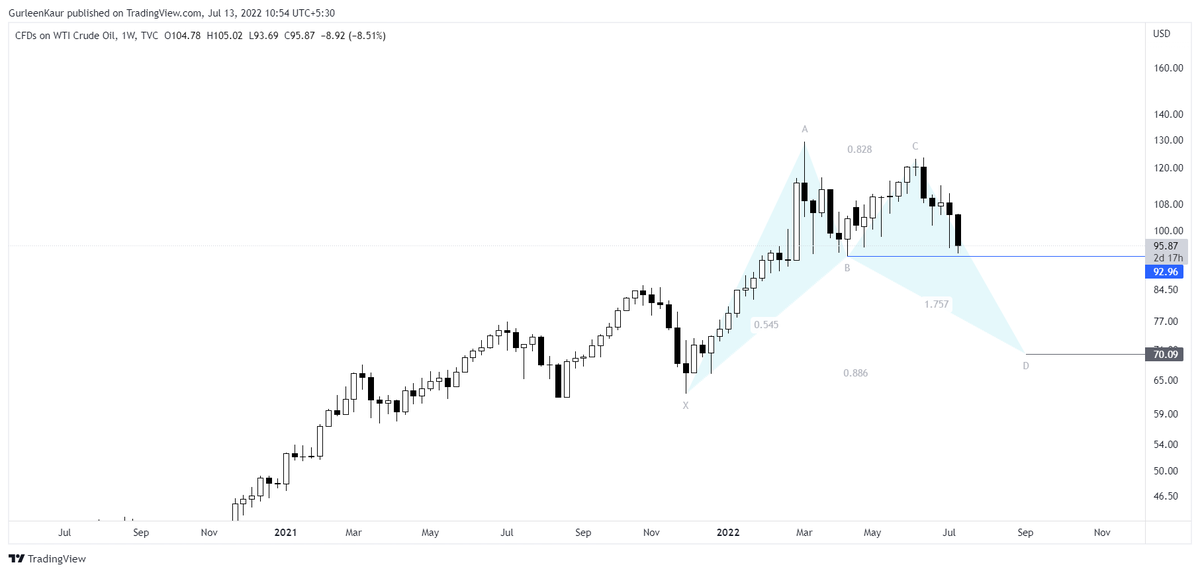
On the Weekly TF, If the price slips and closes below $92.96, the target would be $70.

On the last two instances, when #Brent #CrudeOil crossed 90, NIFTY (in Blue - Left scale) underwent Correction both the times. This is the third such instance.
— Piyush Chaudhry (@piyushchaudhry) February 12, 2022
Below 90, NIFTY & Brent have had positive correlation, with 90 acting as an inflection point & causing the Divergence. pic.twitter.com/Q9dj8YFpuV

Needs to break below this level for real impact. https://t.co/r5KoExzFKc
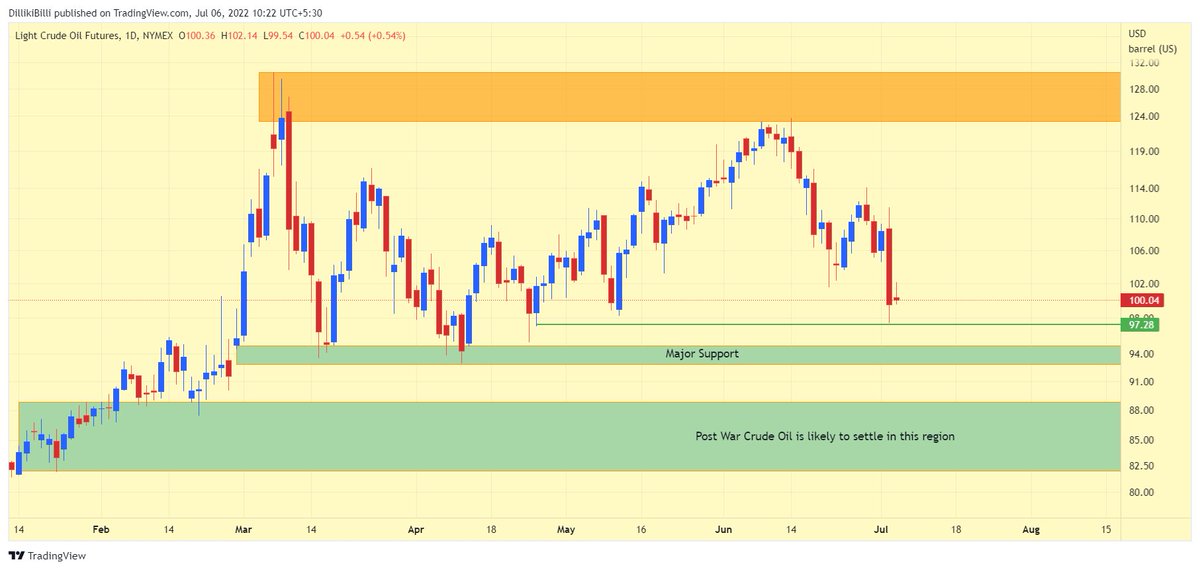
NYMEX Crude Oil update !
— Professor (@DillikiBiili) July 1, 2022
Its not ready to come below US$ 100 which is a big psychological level ! Everytime it comes near that zone, it takes a bounce. https://t.co/xQ3dZZXNiu pic.twitter.com/7WS38JU6JF

Interesting Derivatives Data…
#MarketsWithETNOW | Is the #crude concern overblown? What do the charts indicate? What will be the trend going forward? Watch to find out as @kbbothra analyses #Brent #Crude #Oil #StockMarket pic.twitter.com/4SBSfpiKmd
— ET NOW (@ETNOWlive) June 1, 2022