
#repost
On the last two instances, when #Brent #CrudeOil crossed 90, NIFTY (in Blue - Left scale) underwent Correction both the times. This is the third such instance.
— Piyush Chaudhry (@piyushchaudhry) February 12, 2022
Below 90, NIFTY & Brent have had positive correlation, with 90 acting as an inflection point & causing the Divergence. pic.twitter.com/Q9dj8YFpuV
More from Piyush Chaudhry
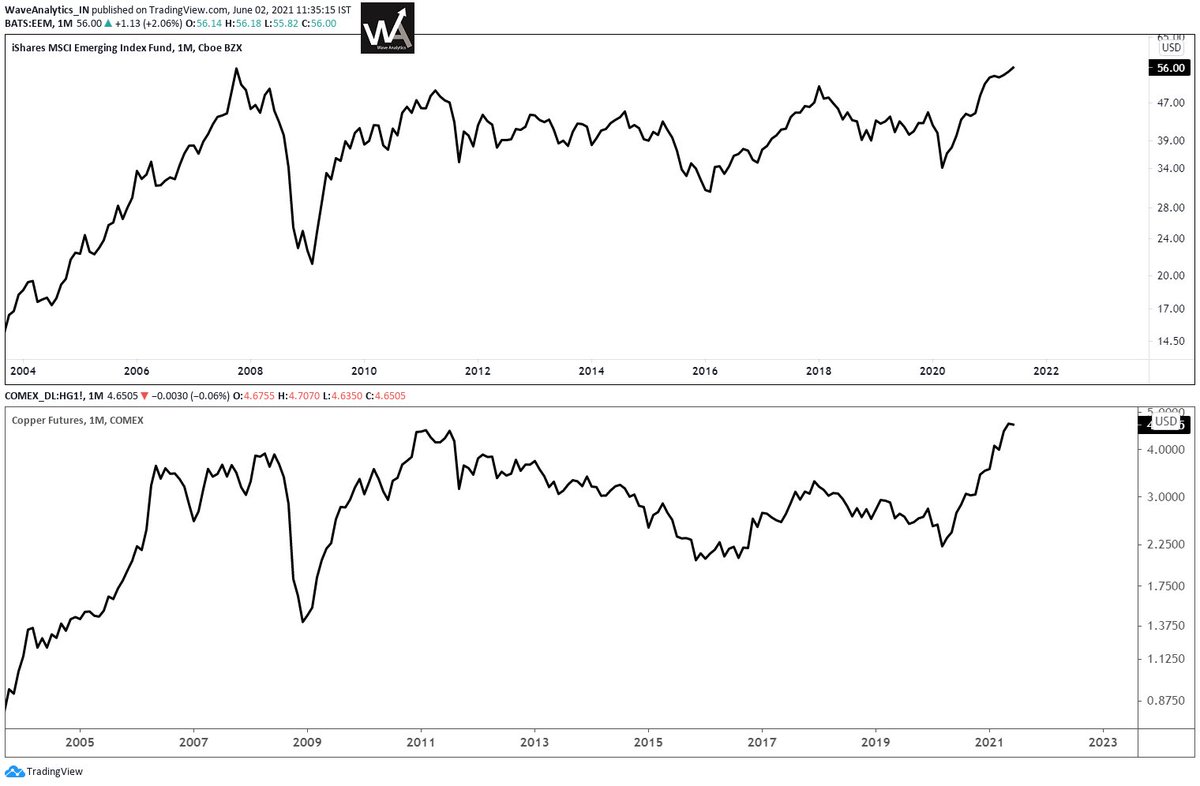
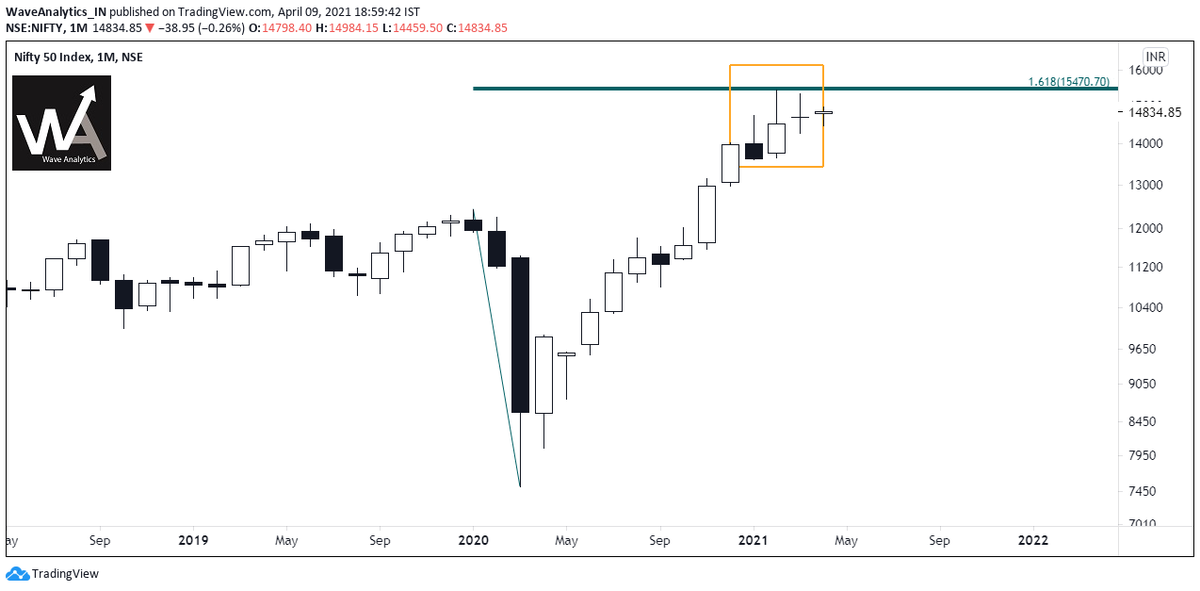
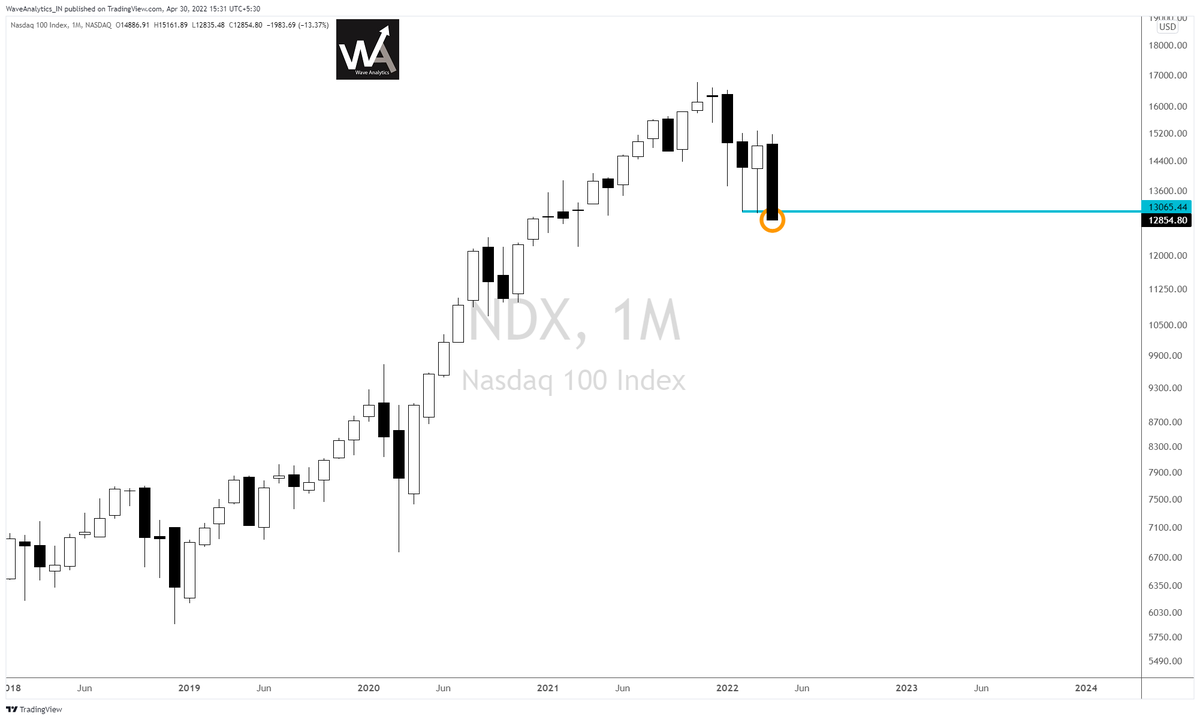
More from Crudeoillongterm

Interesting Derivatives Data…
#MarketsWithETNOW | Is the #crude concern overblown? What do the charts indicate? What will be the trend going forward? Watch to find out as @kbbothra analyses #Brent #Crude #Oil #StockMarket pic.twitter.com/4SBSfpiKmd
— ET NOW (@ETNOWlive) June 1, 2022



A quick thread 🧵
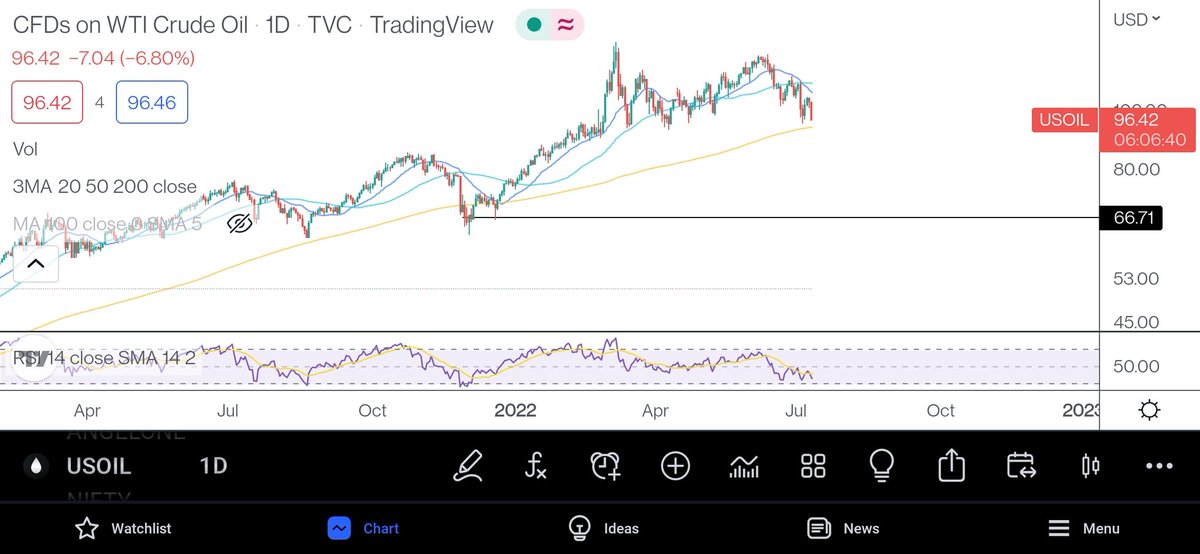
Daily TF
With the turn-around in price from the initial harmonic pattern, Consequent LH-LL's in place.
Below $101.56, We might catch sight of $87 followed by $78 https://t.co/nvzolftng6
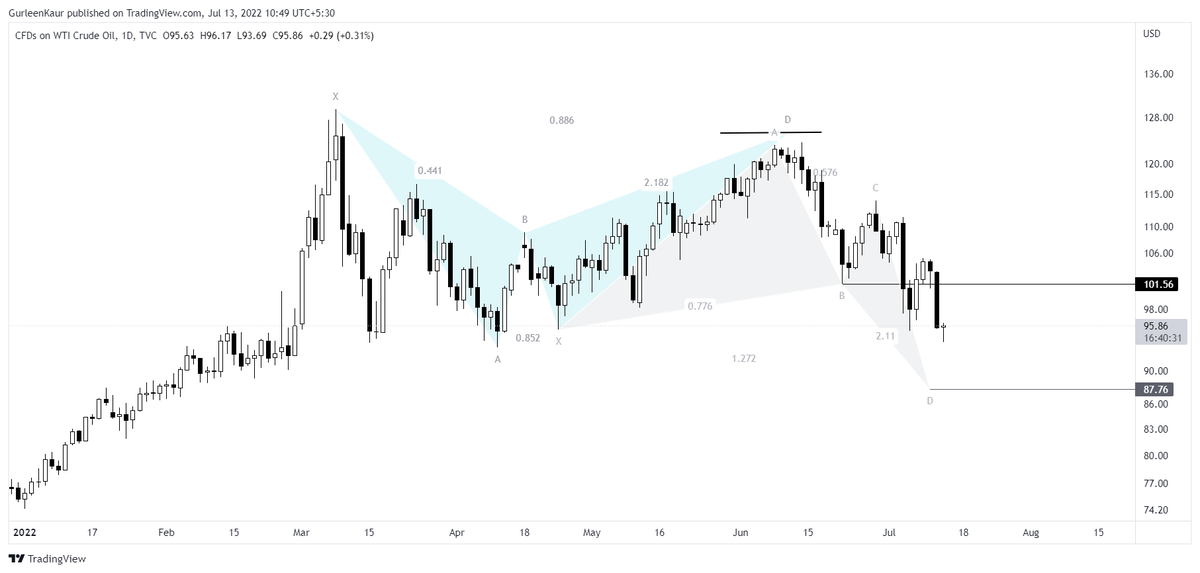
$USOIL
— Gurleen (@GurleenKaur_19) June 6, 2022
With the inching up of reaction lows, the targets are placed at $125 and $134.
In a different case scenario, Let's not rule out the possibility- If the price continues to sustain above the level of $104, Might see a hit towards the level of $150 as well. #CrudeOil pic.twitter.com/p52TnRkBqC
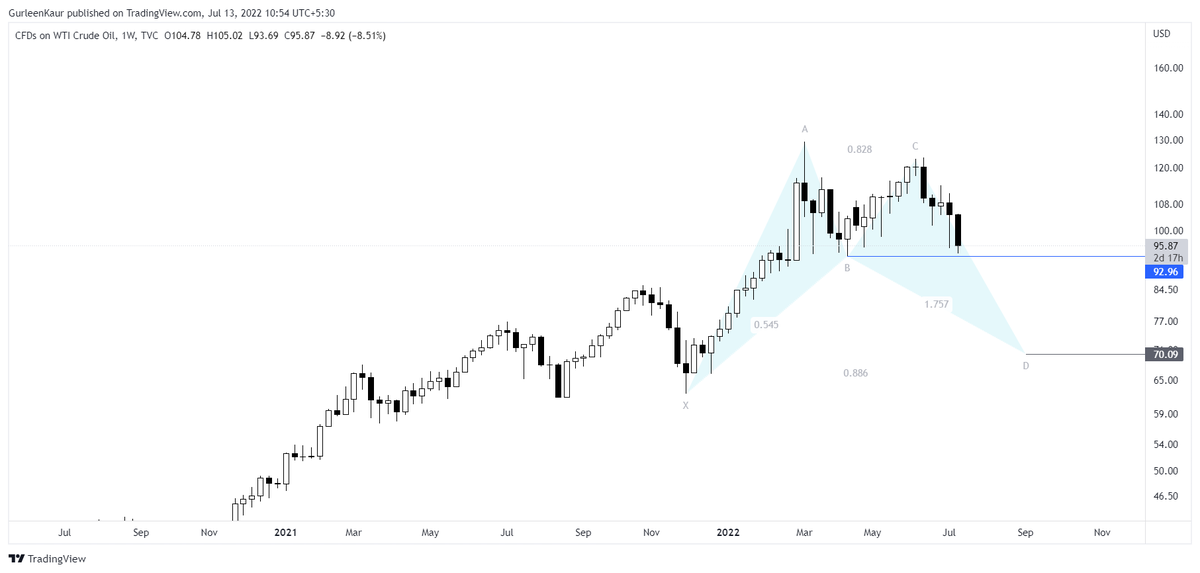
On the Weekly TF, If the price slips and closes below $92.96, the target would be $70.
You May Also Like






1 - open trading view in your browser and select stock scanner in left corner down side .
2 - touch the percentage% gain change ( and u can see higest gainer of today)
Making thread \U0001f9f5 on trading view scanner by which you can select intraday and btst stocks .
— Vikrant (@Trading0secrets) October 22, 2021
In just few hours (Without any watchlist)
Some manual efforts u have to put on it.
Soon going to share the process with u whenever it will be ready .
"How's the josh?"guys \U0001f57a\U0001f3b7\U0001f483
3. Then, start with 6% gainer to 20% gainer and look charts of everyone in daily Timeframe . (For fno selection u can choose 1% to 4% )
4. Then manually select the stocks which are going to give all time high BO or 52 high BO or already given.
5. U can also select those stocks which are going to give range breakout or already given range BO
6 . If in 15 min chart📊 any stock sustaing near BO zone or after BO then select it on your watchlist
7 . Now next day if any stock show momentum u can take trade in it with RM
This looks very easy & simple but,
U will amazed to see it's result if you follow proper risk management.
I did 4x my capital by trading in only momentum stocks.
I will keep sharing such learning thread 🧵 for you 🙏💞🙏
Keep learning / keep sharing 🙏
@AdityaTodmal

