Time for a new thread on the possibilities I am looking for.
Do read it completely to understand the stance and the plan.
This thread will present a highly probable scenario of markets for the upcoming months. Will update the scenario too if there is a significant change in view in between.
— Aakash Gangwar (@akashgngwr823) May 15, 2022
1/n https://t.co/jfWOyEgZyd
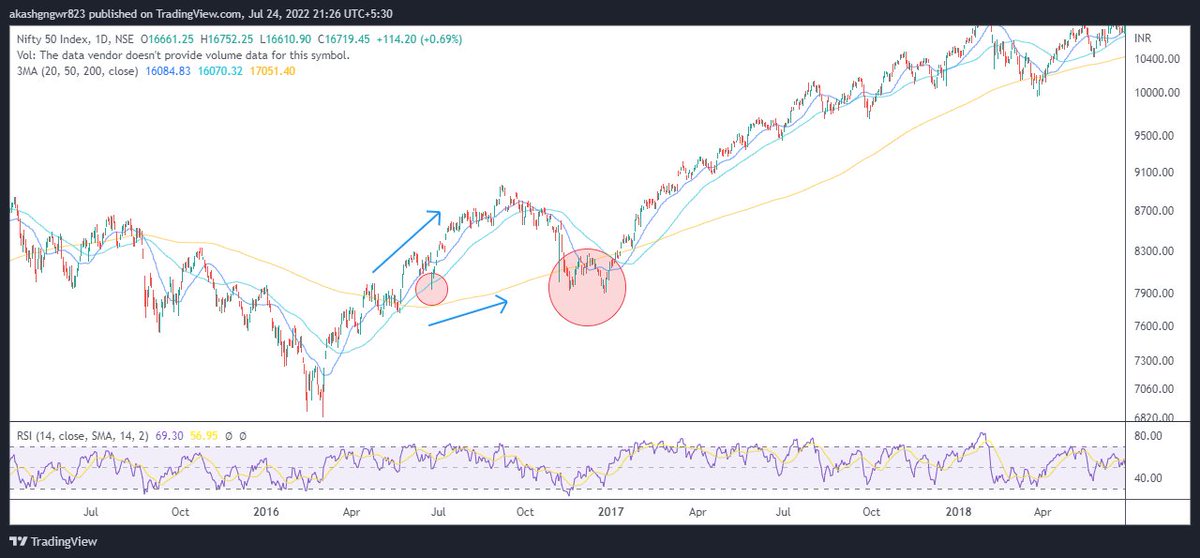

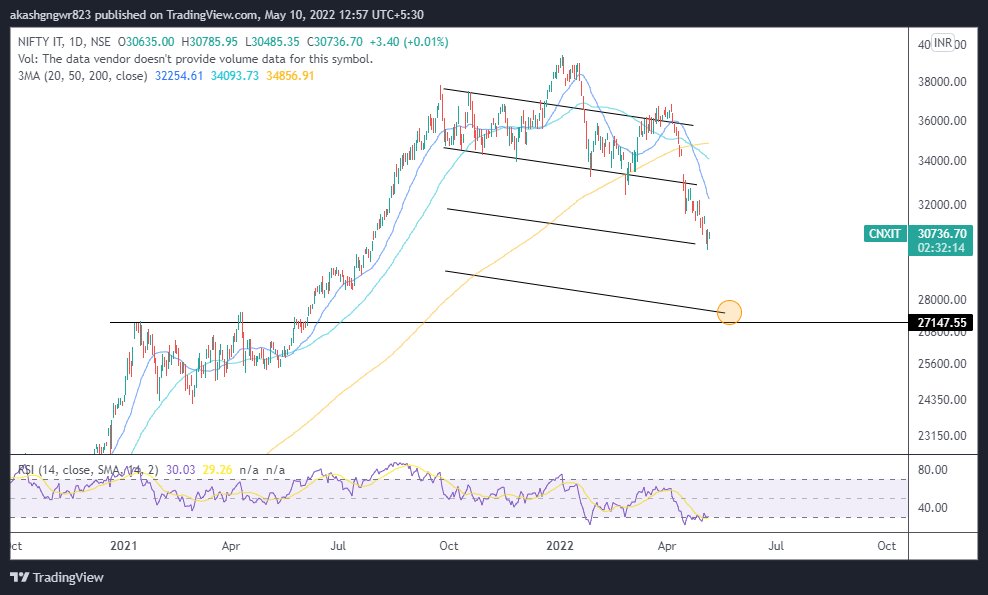
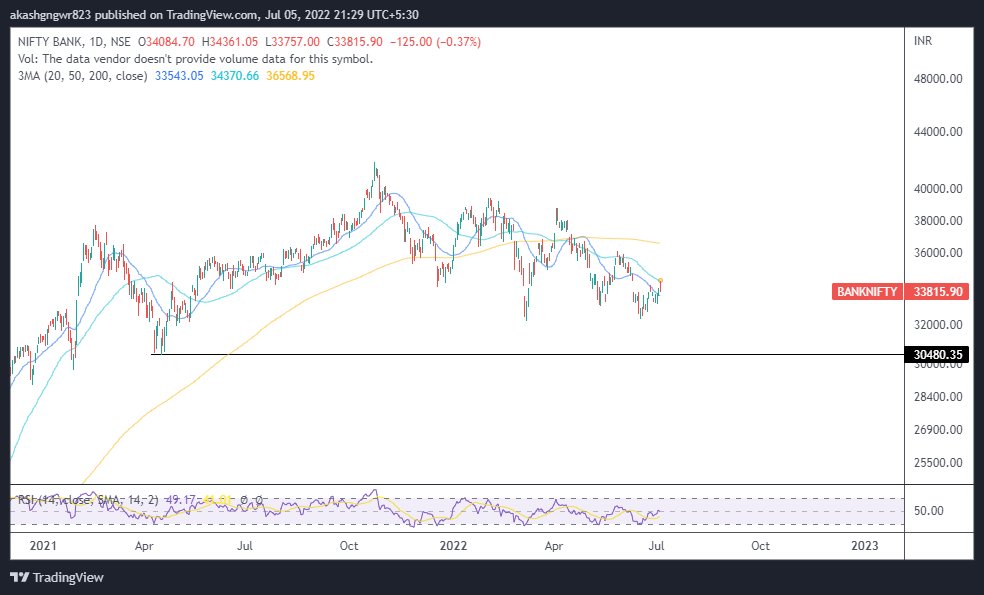
1. Moving averages structure- The moving average structure is a standard corrective fractal which we have already seen in Nifty daily (October - November 2021), Nasdaq weekly (Jan 2022). As of now, 100 WMA looks inevitable and that coincides with the bottom of megaphone.
— Aakash Gangwar (@akashgngwr823) May 15, 2022
2/n pic.twitter.com/O1eAng99Vz
More from Aakash Gangwar
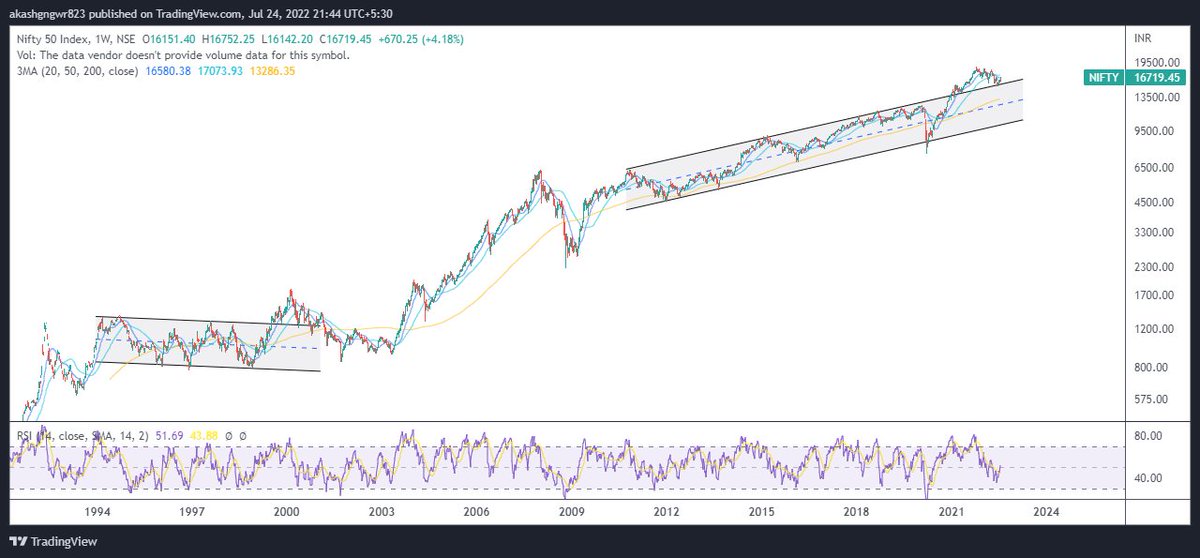
Still having the same view. Will update if there is any change. Falling trendline breakout doesn't work that way in a bear market the way it works in a bull market. Updating your methods according to the market is the key.
#nifty50 https://t.co/64ZktWHQev
#nifty50 https://t.co/64ZktWHQev
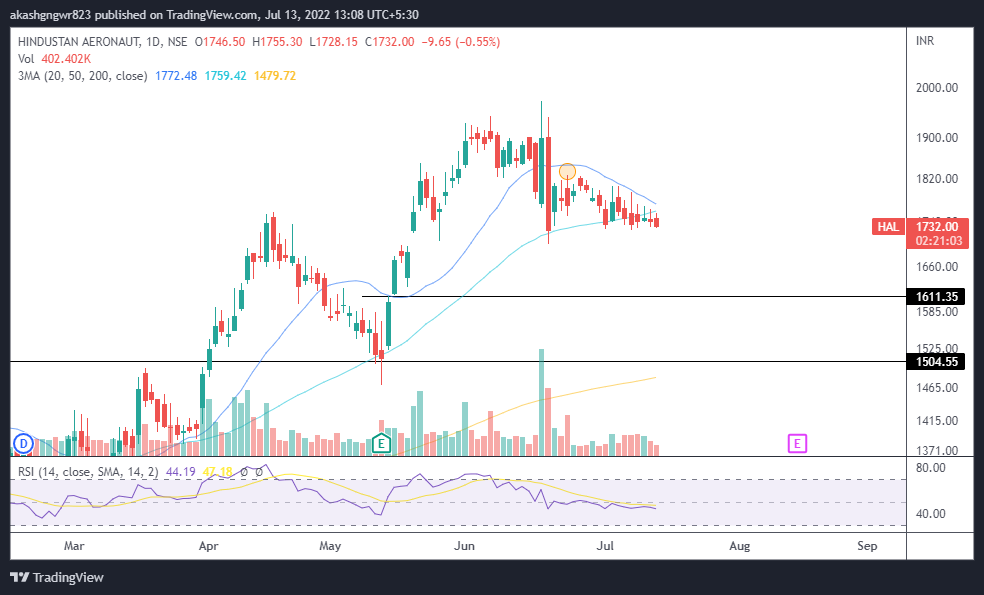
This is the maximum upside for now, post that I am looking for an 8-9% fall in index.#nifty50 pic.twitter.com/BcSOiwWuBs
— Aakash Gangwar (@akashgngwr823) June 24, 2022
More from Screeners


You May Also Like

1/OK, data mystery time.
This New York Times feature shows China with a Gini Index of less than 30, which would make it more equal than Canada, France, or the Netherlands. https://t.co/g3Sv6DZTDE
That's weird. Income inequality in China is legendary.
Let's check this number.
2/The New York Times cites the World Bank's recent report, "Fair Progress? Economic Mobility across Generations Around the World".
The report is available here:
3/The World Bank report has a graph in which it appears to show the same value for China's Gini - under 0.3.
The graph cites the World Development Indicators as its source for the income inequality data.

4/The World Development Indicators are available at the World Bank's website.
Here's the Gini index: https://t.co/MvylQzpX6A
It looks as if the latest estimate for China's Gini is 42.2.
That estimate is from 2012.
5/A Gini of 42.2 would put China in the same neighborhood as the U.S., whose Gini was estimated at 41 in 2013.
I can't find the <30 number anywhere. The only other estimate in the tables for China is from 2008, when it was estimated at 42.8.
This New York Times feature shows China with a Gini Index of less than 30, which would make it more equal than Canada, France, or the Netherlands. https://t.co/g3Sv6DZTDE
That's weird. Income inequality in China is legendary.
Let's check this number.
2/The New York Times cites the World Bank's recent report, "Fair Progress? Economic Mobility across Generations Around the World".
The report is available here:
3/The World Bank report has a graph in which it appears to show the same value for China's Gini - under 0.3.
The graph cites the World Development Indicators as its source for the income inequality data.
4/The World Development Indicators are available at the World Bank's website.
Here's the Gini index: https://t.co/MvylQzpX6A
It looks as if the latest estimate for China's Gini is 42.2.
That estimate is from 2012.
5/A Gini of 42.2 would put China in the same neighborhood as the U.S., whose Gini was estimated at 41 in 2013.
I can't find the <30 number anywhere. The only other estimate in the tables for China is from 2008, when it was estimated at 42.8.