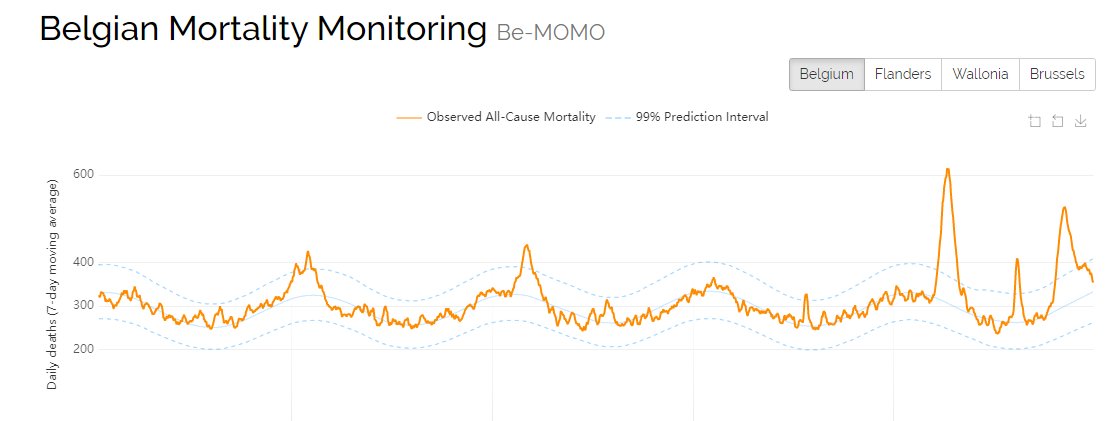
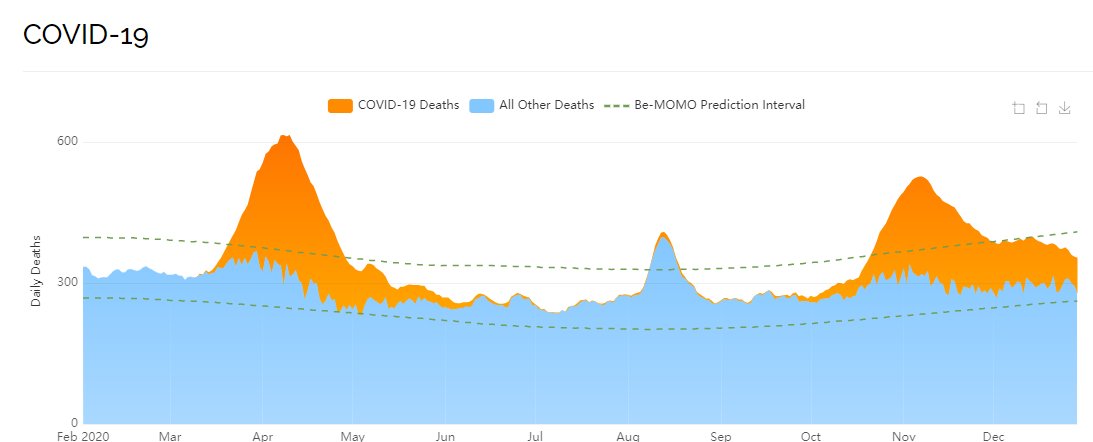
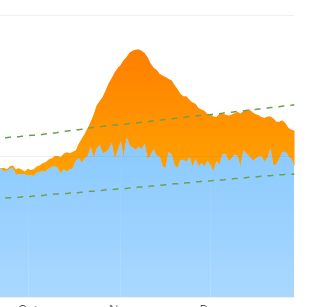
(1) BELGIUM: @alexanderdecroo @GLBouchez @ducarmedenis Number of false PCR positives of asymptomatic people still high and obviously not showing right picture. Deaths way down and show the absolute uselessnes of mass testing.



More from Trading


1/ Feels like a good time to tell the story of how I went from broke to a millionaire to broke again in 2017/18 again...
Yesterday was brutal for some people...
Losing life-changing money sucks, losing any money sucks...you can chase the market or you can change your strategy.
2/ The original thread is gone but you can read it here.
https://t.co/cLLNs75rB0
tl;dr
- Traded $32k to $1.2m
- Thought I was a genius
- Made poor investments
- Didn't conserve capital
- Peaked at 150 BTC
- Lost nearly all of it
2 weeks from losing my house + no income. Oops.
3/ I am going to assume you are in it for the money rather than the tech. Yeah, you might Tweet about the amazing blockchaining of cross-border payments and oracles yadda yadda...really, you are in it to make money.
If you are really in it for the tech, go and build something.
4/ Okay, so if you want to make money, trading is super hard, you are trading against:
- Better traders than you
- People who can move markets
- Unknown information
And if you are trading with leverage you might blow up your account with the volatility.
5/ If you are not trading, you are investing. Okay, so what are you investing in?
I made the decision that the crypto with the best opportunity of existing in 10 years is #Bitcoin:
- Solves a genuine problem
- The right tech
- A proven track record
Yesterday was brutal for some people...
Losing life-changing money sucks, losing any money sucks...you can chase the market or you can change your strategy.
2/ The original thread is gone but you can read it here.
https://t.co/cLLNs75rB0
tl;dr
- Traded $32k to $1.2m
- Thought I was a genius
- Made poor investments
- Didn't conserve capital
- Peaked at 150 BTC
- Lost nearly all of it
2 weeks from losing my house + no income. Oops.
3/ I am going to assume you are in it for the money rather than the tech. Yeah, you might Tweet about the amazing blockchaining of cross-border payments and oracles yadda yadda...really, you are in it to make money.
If you are really in it for the tech, go and build something.
4/ Okay, so if you want to make money, trading is super hard, you are trading against:
- Better traders than you
- People who can move markets
- Unknown information
And if you are trading with leverage you might blow up your account with the volatility.
5/ If you are not trading, you are investing. Okay, so what are you investing in?
I made the decision that the crypto with the best opportunity of existing in 10 years is #Bitcoin:
- Solves a genuine problem
- The right tech
- A proven track record