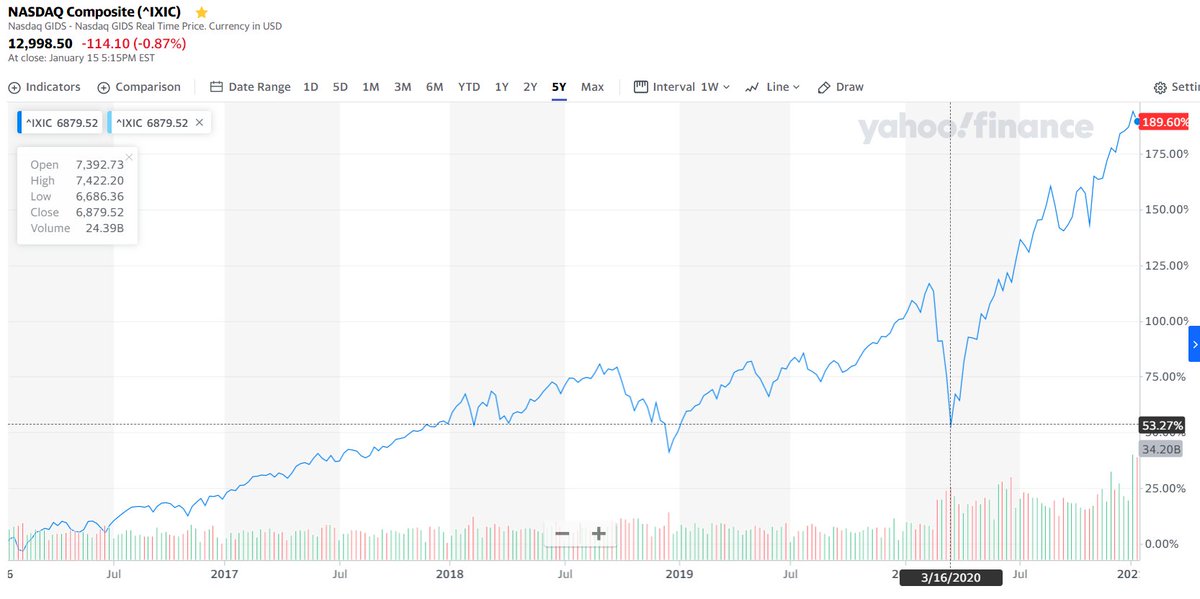
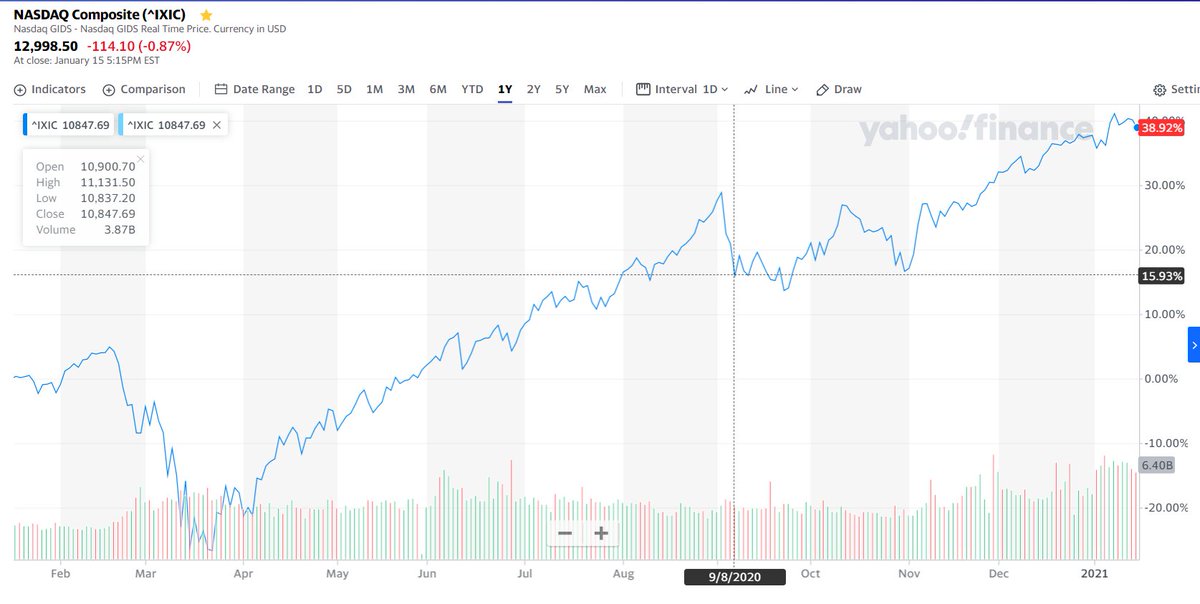
The is a tech bubble in the stock market, and it will burst soon. The question is, which of the #NGS companies below will come out stronger from the stock market tech bubble bursting? $ILMN $PACB @nanopore @MGI_BGI
Who will come out stronger from the stock market tech bubble in #NGS? https://t.co/TDn5J0glhi
— Albert Vilella (@AlbertVilella) January 11, 2021
More from Trading

DJ @ITRADE191 multiple chart analysis for INTRADAY TRADING.
1. Core setup
2. Pivot points trades
3. PDH/PDL trades
4. Open interest addictions combined with rejections on charts.
5. Website to confirm bias
Very quick read.
Share if you liked for the benefit of everyone.
•Main setup of @ITRADE191
He used this setup daily for all trades.
1. EMA crossover 10/20
2. Supertrend 10/3
3. Vwap
4. RSI >
•Volume always greater than
•Candle Rejecting from
•Pivot settings
1. Core setup
2. Pivot points trades
3. PDH/PDL trades
4. Open interest addictions combined with rejections on charts.
5. Website to confirm bias
Very quick read.
Share if you liked for the benefit of everyone.
•Main setup of @ITRADE191
He used this setup daily for all trades.
1. EMA crossover 10/20
2. Supertrend 10/3
3. Vwap
4. RSI >
@MiteshFan @Mitesh_Engr @Abhishekkar_ MY TRADING SETUP .... I've been using it for a long time .. result good try it \U0001f607 pic.twitter.com/XThUD0ftbl
— itrade(DJ) (@ITRADE191) June 13, 2020
•Volume always greater than
Volume Should always be above 20 pic.twitter.com/CPgxLgpPKF
— itrade(DJ) (@ITRADE191) June 13, 2020
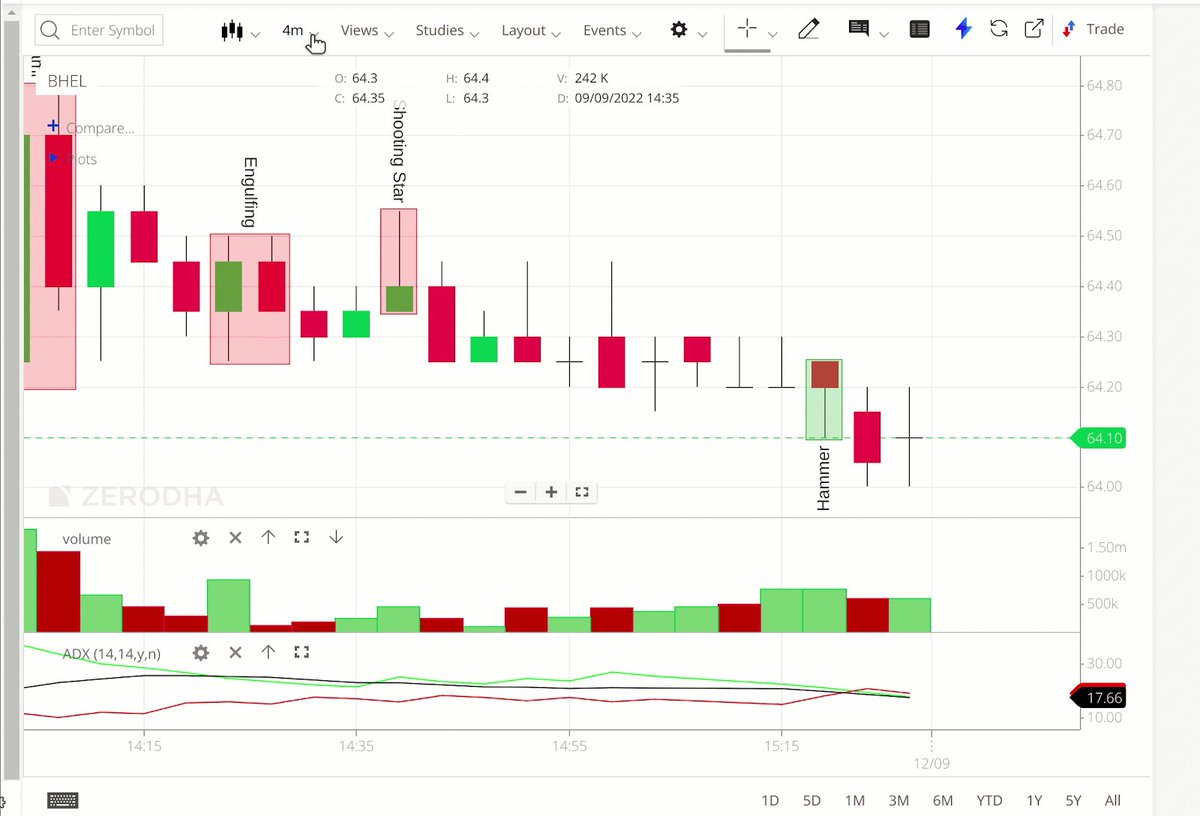
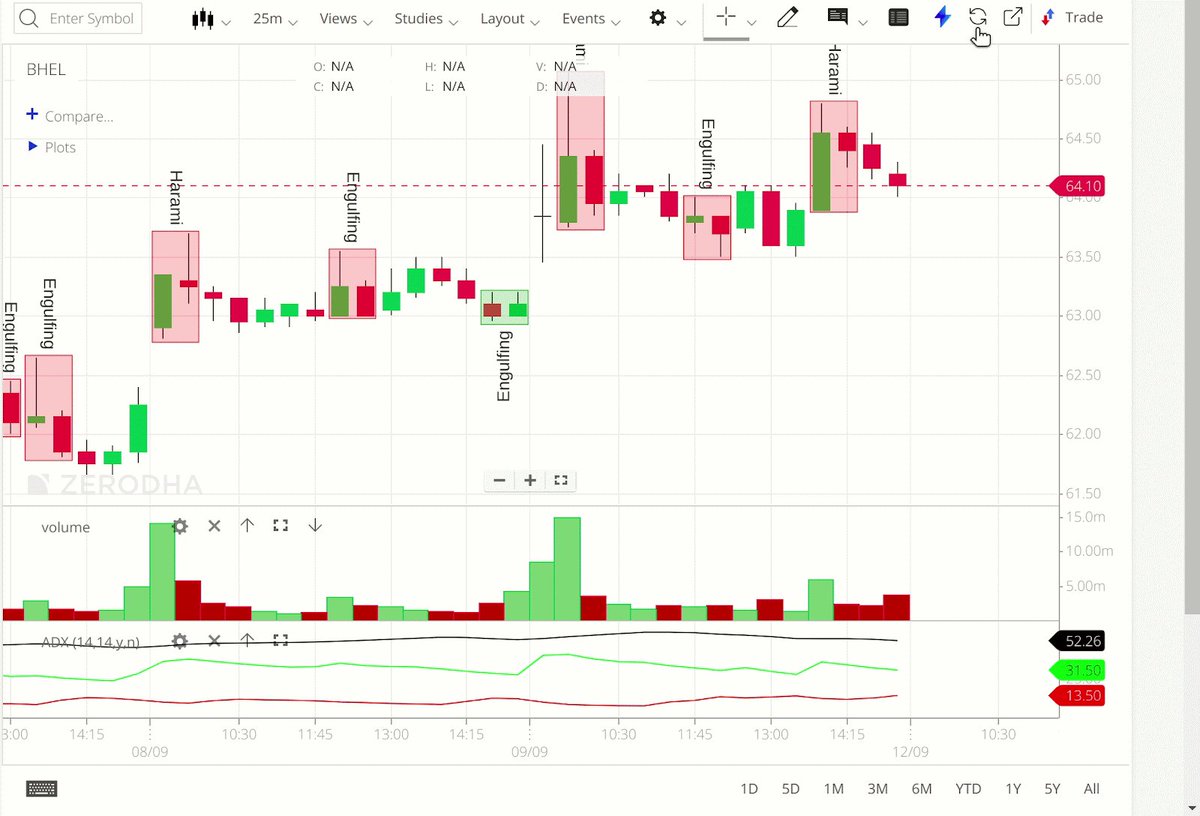
•Candle Rejecting from
— itrade(DJ) (@ITRADE191) August 25, 2020
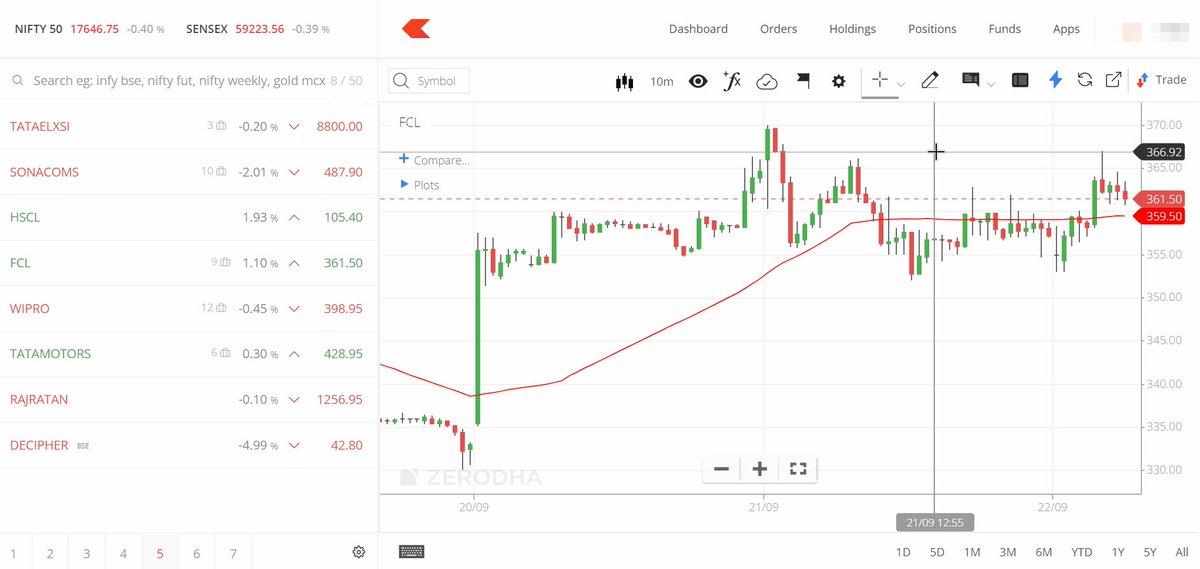
•Pivot settings
— itrade(DJ) (@ITRADE191) October 20, 2020


You May Also Like

1/OK, data mystery time.
This New York Times feature shows China with a Gini Index of less than 30, which would make it more equal than Canada, France, or the Netherlands. https://t.co/g3Sv6DZTDE
That's weird. Income inequality in China is legendary.
Let's check this number.
2/The New York Times cites the World Bank's recent report, "Fair Progress? Economic Mobility across Generations Around the World".
The report is available here:
3/The World Bank report has a graph in which it appears to show the same value for China's Gini - under 0.3.
The graph cites the World Development Indicators as its source for the income inequality data.

4/The World Development Indicators are available at the World Bank's website.
Here's the Gini index: https://t.co/MvylQzpX6A
It looks as if the latest estimate for China's Gini is 42.2.
That estimate is from 2012.
5/A Gini of 42.2 would put China in the same neighborhood as the U.S., whose Gini was estimated at 41 in 2013.
I can't find the <30 number anywhere. The only other estimate in the tables for China is from 2008, when it was estimated at 42.8.
This New York Times feature shows China with a Gini Index of less than 30, which would make it more equal than Canada, France, or the Netherlands. https://t.co/g3Sv6DZTDE
That's weird. Income inequality in China is legendary.
Let's check this number.
2/The New York Times cites the World Bank's recent report, "Fair Progress? Economic Mobility across Generations Around the World".
The report is available here:
3/The World Bank report has a graph in which it appears to show the same value for China's Gini - under 0.3.
The graph cites the World Development Indicators as its source for the income inequality data.
4/The World Development Indicators are available at the World Bank's website.
Here's the Gini index: https://t.co/MvylQzpX6A
It looks as if the latest estimate for China's Gini is 42.2.
That estimate is from 2012.
5/A Gini of 42.2 would put China in the same neighborhood as the U.S., whose Gini was estimated at 41 in 2013.
I can't find the <30 number anywhere. The only other estimate in the tables for China is from 2008, when it was estimated at 42.8.