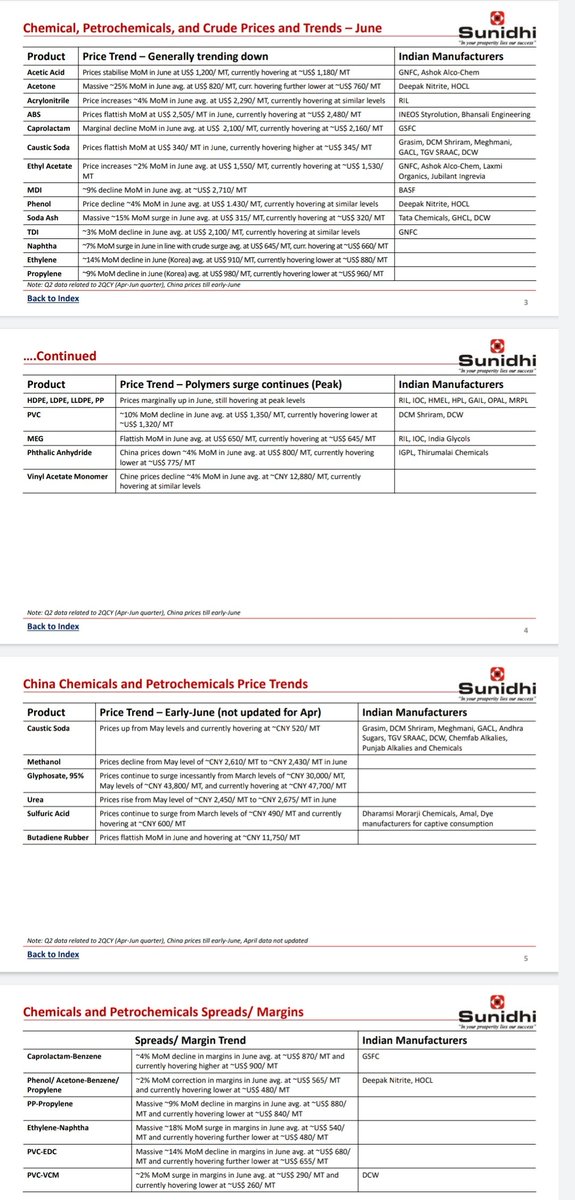
𝐂𝐡𝐞𝐦𝐢𝐜𝐚𝐥 𝐏𝐫𝐢𝐜𝐞 𝐓𝐫𝐞𝐧𝐝 𝐔𝐩𝐝𝐚𝐭𝐞
More from Raghav Chaudhary

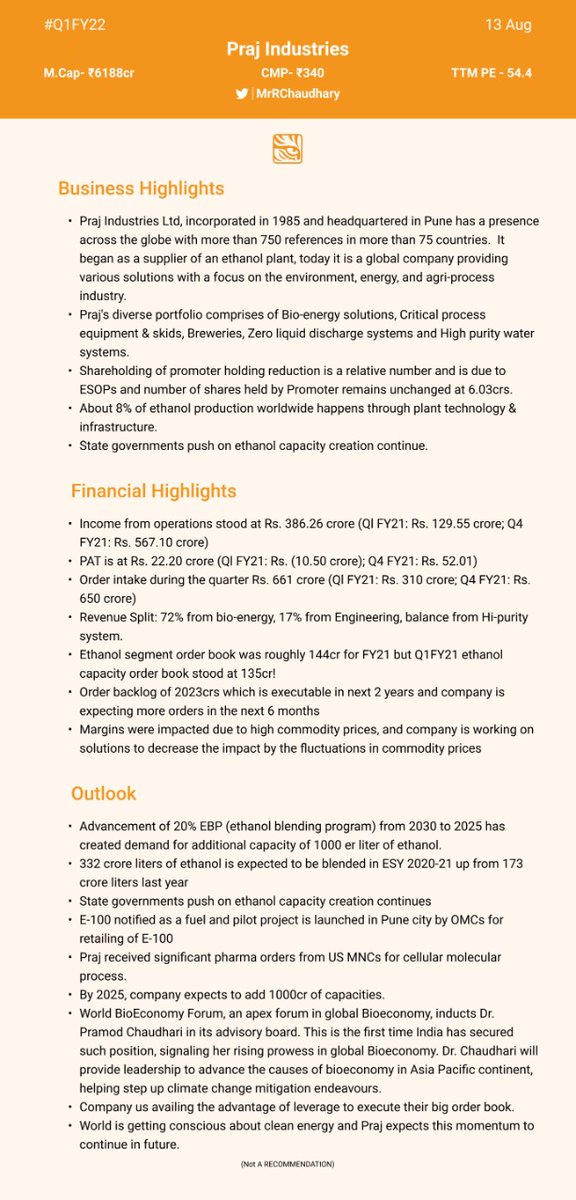
ROCE GENERATION of 20-25% In Coming Qtrs !
(Weekend Is Coming😏) https://t.co/vQw9N2UFgZ
#TataCoffee - Concall Snippet !
— Raghav Chaudhary (@MrRChaudhary) July 29, 2021
Expects Margin Expansion in India Coffee.
(Only For Educational Purpose) pic.twitter.com/Dcd6uW7l0R
More from Stockslearnings

Thread's on:
• How to find targets and exit criteria?
• Shanon's Demon (Investing)
• Tradingview scanner- Intraday/BTST
• 90-degree angle inflection point for profit-booking
• Importance of Leverage
Other cool tweets as well.
🧵Shannon's Demon - an investing "thought exercise"
This account writes the best threads, if you like the threads I make, you will surely love this account. Must
1/
— 10-K Diver (@10kdiver) October 23, 2021
Get a cup of coffee.
In this thread, I'll walk you through Shannon's Demon.
This is an investing "thought exercise" -- posed by the great scientist Claude Shannon.
Solving this exercise can teach us a lot about favorable vs unfavorable long-term bets, position sizing, etc.
🧵Finding expected targets and exit criteria to look for to exit the
How to find out the expected targets and what should be the exit criteria when you enter a trade - \U0001f9f5
— Sheetal Rijhwani (@RijhwaniSheetal) October 25, 2021
Possible ways to find out the target:
Check if any patterns forming - it gets quite easy to figure out the targets that way. (1/15)
🧵Trading View Scanner process to trade in momentum stocks.
Trading view scanner process -
— Vikrant (@Trading0secrets) October 23, 2021
1 - open trading view in your browser and select stock scanner in left corner down side .
2 - touch the percentage% gain change ( and u can see higest gainer of today) https://t.co/GGWSZXYMth
🧵90-degree angle inflection point for
The 90 degree angle inflection point in a stock is a signal to book profit
— Nikita Poojary (@niki_poojary) October 24, 2021
Lets understand with a recent example of a stock #IRCTC \U0001f683\U0001f68b
Time for a thread\U0001f9f5



You May Also Like


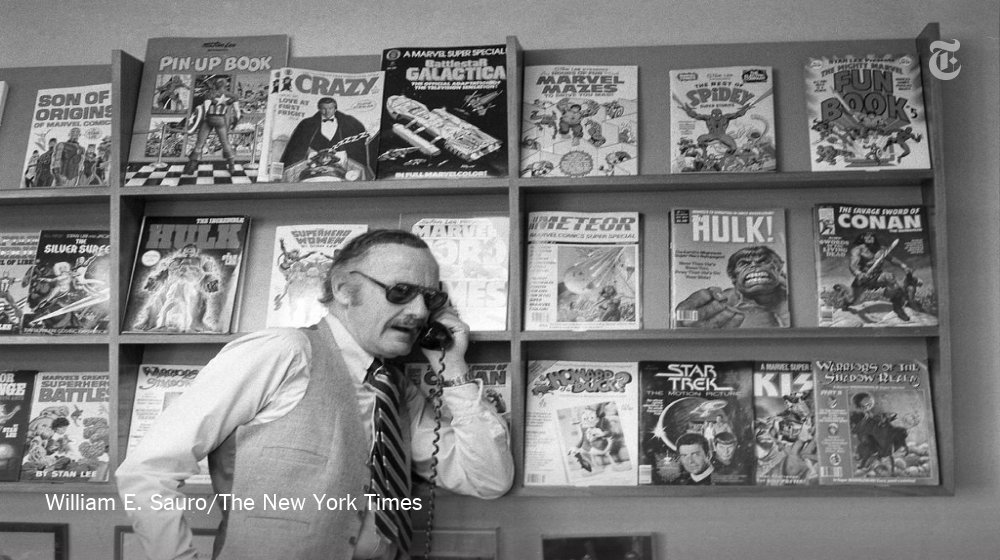
Stan Lee, who died Monday at 95, was born in Manhattan and graduated from DeWitt Clinton High School in the Bronx. His pulp-fiction heroes have come to define much of popular culture in the early 21st century.
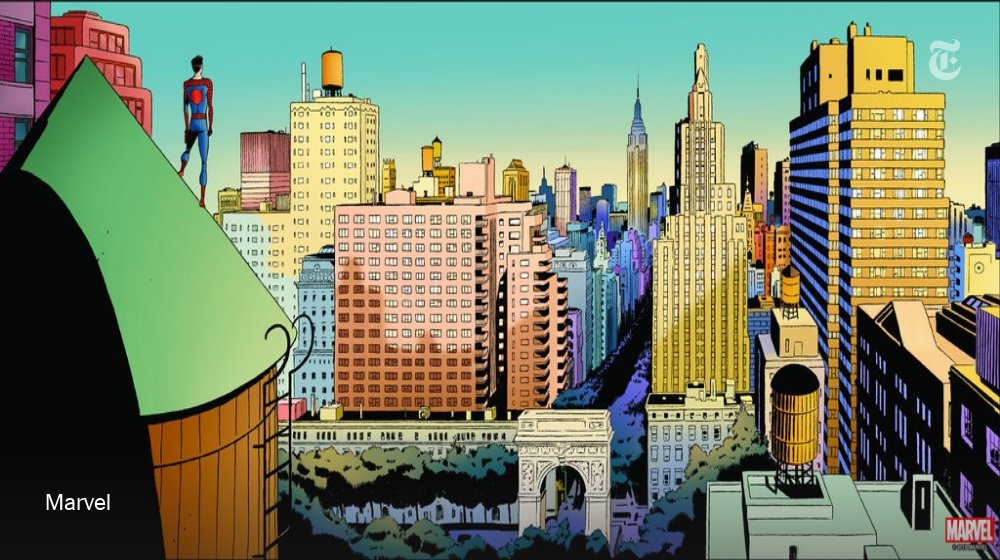
Tying Marvel’s stable of pulp-fiction heroes to a real place — New York — served a counterbalance to the sometimes gravity-challenged action and the improbability of the stories. That was just what Stan Lee wanted. https://t.co/rDosqzpP8i

The New York universe hooked readers. And the artists drew what they were familiar with, which made the Marvel universe authentic-looking, down to the water towers atop many of the buildings. https://t.co/rDosqzpP8i
The Avengers Mansion was a Beaux-Arts palace. Fans know it as 890 Fifth Avenue. The Frick Collection, which now occupies the place, uses the address of the front door: 1 East 70th Street.

To me, the most important aspect of the 2018 midterms wasn't even about partisan control, but about democracy and voting rights. That's the real battle.
2/The good news: It's now an issue that everyone's talking about, and that everyone cares about.
3/More good news: Florida's proposition to give felons voting rights won. But it didn't just win - it won with substantial support from Republican voters.
That suggests there is still SOME grassroots support for democracy that transcends
4/Yet more good news: Michigan made it easier to vote. Again, by plebiscite, showing broad support for voting rights as an
5/OK, now the bad news.
We seem to have accepted electoral dysfunction in Florida as a permanent thing. The 2000 election has never really
Bad ballot design led to a lot of undervotes for Bill Nelson in Broward Co., possibly even enough to cost him his Senate seat. They do appear to be real undervotes, though, instead of tabulation errors. He doesn't really seem to have a path to victory. https://t.co/utUhY2KTaR
— Nate Silver (@NateSilver538) November 16, 2018
![Peter McCormack [Jan/3\u279e\u20bf \U0001f511\u220e]](https://pbs.twimg.com/profile_images/1524287442307723265/_59ITDbJ_normal.jpg)