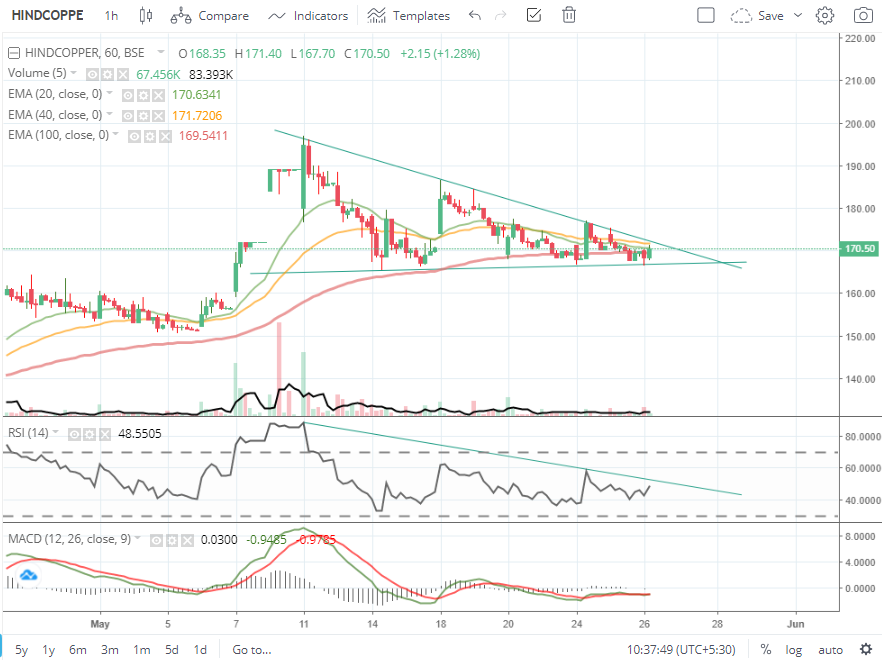
#HindCopper
10% more gains to 127.75 !! 🍻🔥🚀
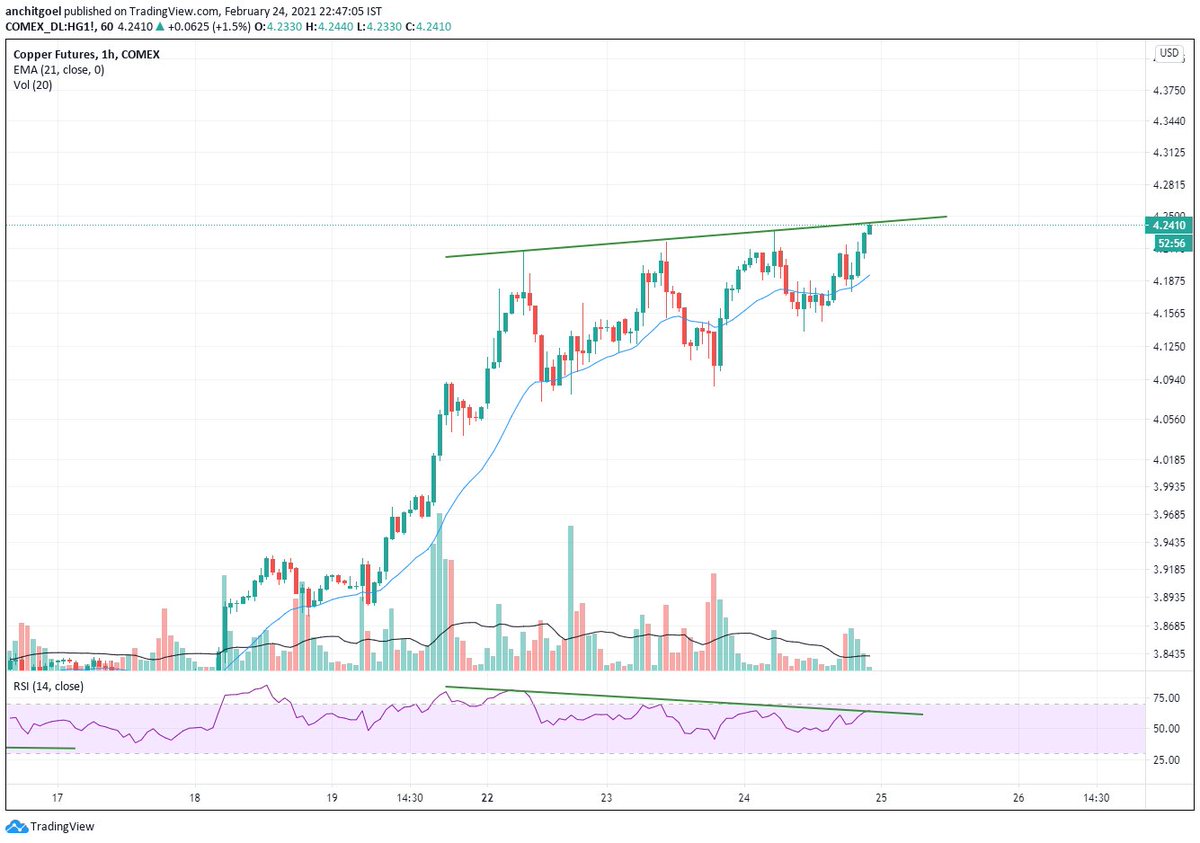
Expecting it to consolidate now in coming days before a final move to 145-150 levels. #Copper RSI is overheated and needs to cool down.
Negative divergence building up on hourly charts. https://t.co/sBU4O6QZsq
#HindCopper
— Anchit Goel (@anchitsays) February 23, 2021
20% Upper Circuit at 118.05 now!! \U0001f389\U0001fa85\U0001f525\U0001f680\U0001f973\U0001f37b\U0001f60d
Conviction and patience has given excellent results. https://t.co/T5y2CBY9Lt pic.twitter.com/xvDeR91PkL
More from Anchit Goel


More from Stockslearnings


#Freetip
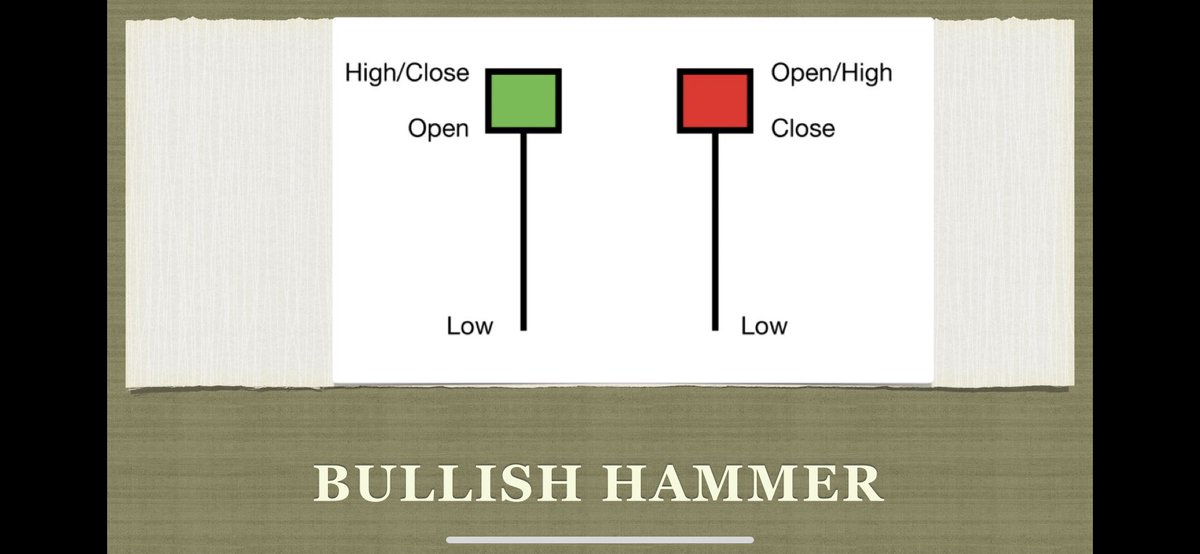
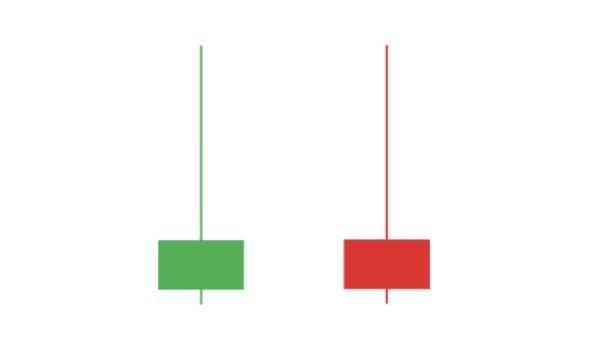
Today's move is an example of this tweet. Save this chart for future ref. https://t.co/amUhSLrET3
Today's move is an example of this tweet. Save this chart for future ref. https://t.co/amUhSLrET3
#FreeTip
— HMK alias MANOJ (@scorpiomanojFRM) June 23, 2021
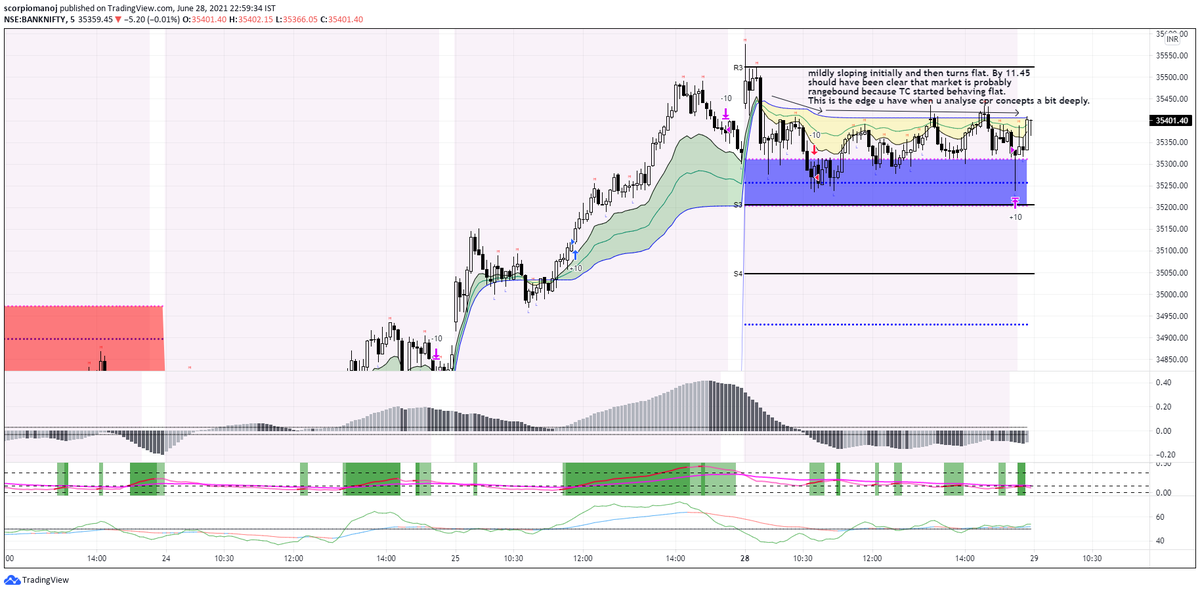
A general rule to assess if a market is ranging is to look at developing TC and / or developing BC. If either of them is flat, it means market is currently ranging. If you are trading in 5 min, go to a lower tf chart, say, 2 min to have a less lagging assessment.