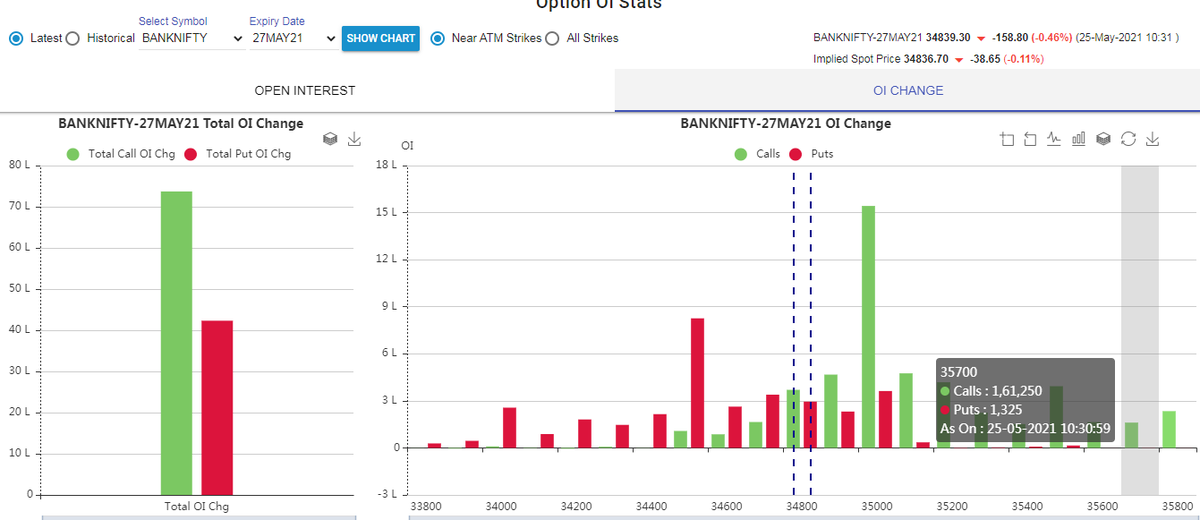
-Check Banknifty change in OI data at 9:45, and identify the highest OI built up in call side and put side
-We will sell both strikes with combined premium as SL on both legs.
(2/n)


Why few traders are going bankrupt after attaining huge success.
— Mitesh Patel (@Mitesh_Engr) September 4, 2021
Could be the following psychology.
During initial days trader is generating huge ROI with less capital.
There are many strategies in market \U0001f4c9and it's possible to get monthly 4% return consistently if you master \U0001f4aain one strategy .
— Kavita (@Kavitastocks) September 4, 2021
One of those strategies which I like is Iron Fly\u2708\ufe0f
Few important points on Iron fly stategy
Here is the detailed information of about strategy,
— itrade(DJ) (@ITRADE191) September 4, 2021
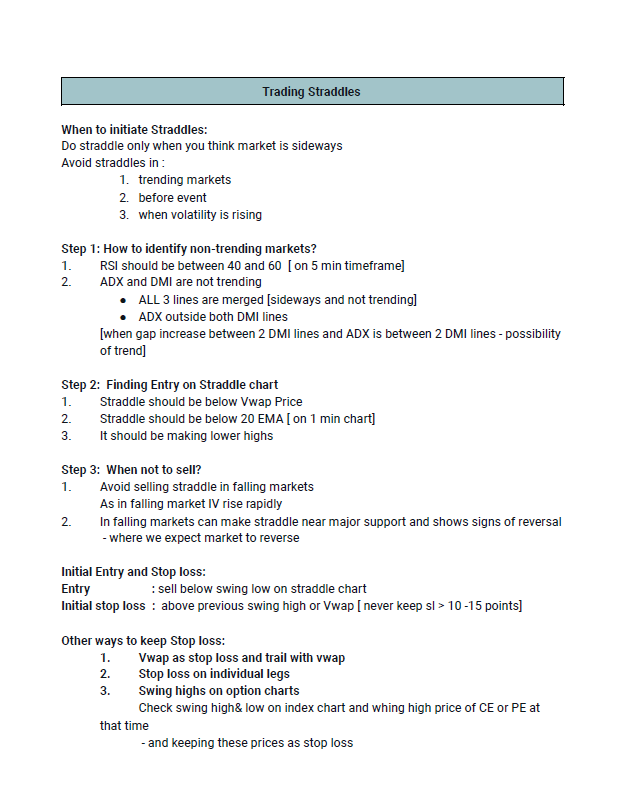
Entry time : 9.30 - 10
Exit : Upto you
Strategy :
Sell weekly ATM CE & PE at almost equal price
For ex : Sell Nifty 17250 CE at 50 and Nifty 17250 PE at 48 so it will become short straddle
If it takes 15 Long Years (180+ months) to Build the First Crore Rupees, the Second will take a Few Years Lesser. The Third will be Effortless & The Fourth Happens Seamlessly.
— Fundamental Investor \u2122 \U0001f1ee\U0001f1f3 (@FI_InvestIndia) September 5, 2021
This is the Power of Patience, Base Effect & Compounding !!!#FI


![Peter McCormack [Jan/3\u279e\u20bf \U0001f511\u220e]](https://pbs.twimg.com/profile_images/1524287442307723265/_59ITDbJ_normal.jpg)