In such a case, H&S can be either a continuation pattern or compound fulcrum.
This is how to differentiate:
• if right shoulder is smaller than left, most likely a continuation H&S
• if right is same or higher than left, and the price is not coming to neckline, most likely CF
sir a doubt does head & shoulders work in down trend ? pic.twitter.com/dytYmbzOfp
— Vega_Greek (@VegaGreek) May 13, 2021
More from Piyush Chaudhry


#repost
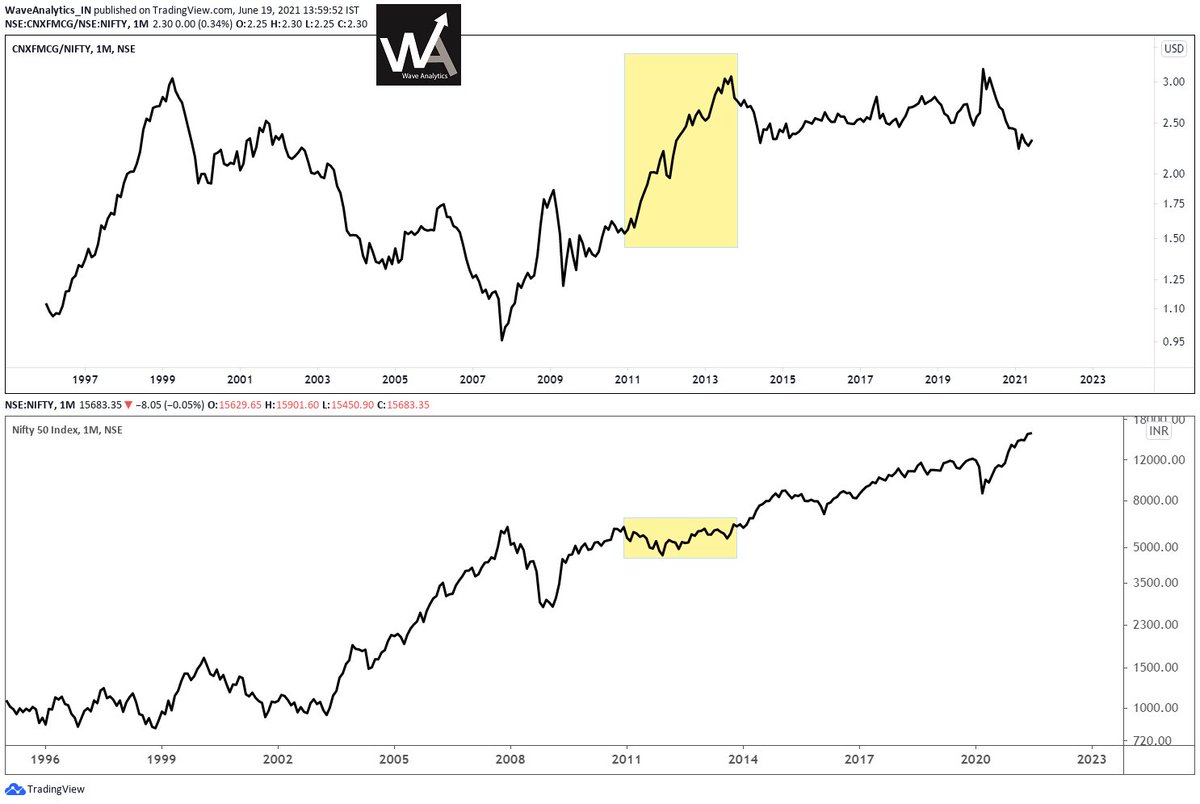
On the last two instances, when #Brent #CrudeOil crossed 90, NIFTY (in Blue - Left scale) underwent Correction both the times. This is the third such instance.
— Piyush Chaudhry (@piyushchaudhry) February 12, 2022
Below 90, NIFTY & Brent have had positive correlation, with 90 acting as an inflection point & causing the Divergence. pic.twitter.com/Q9dj8YFpuV
More from Stockslearnings

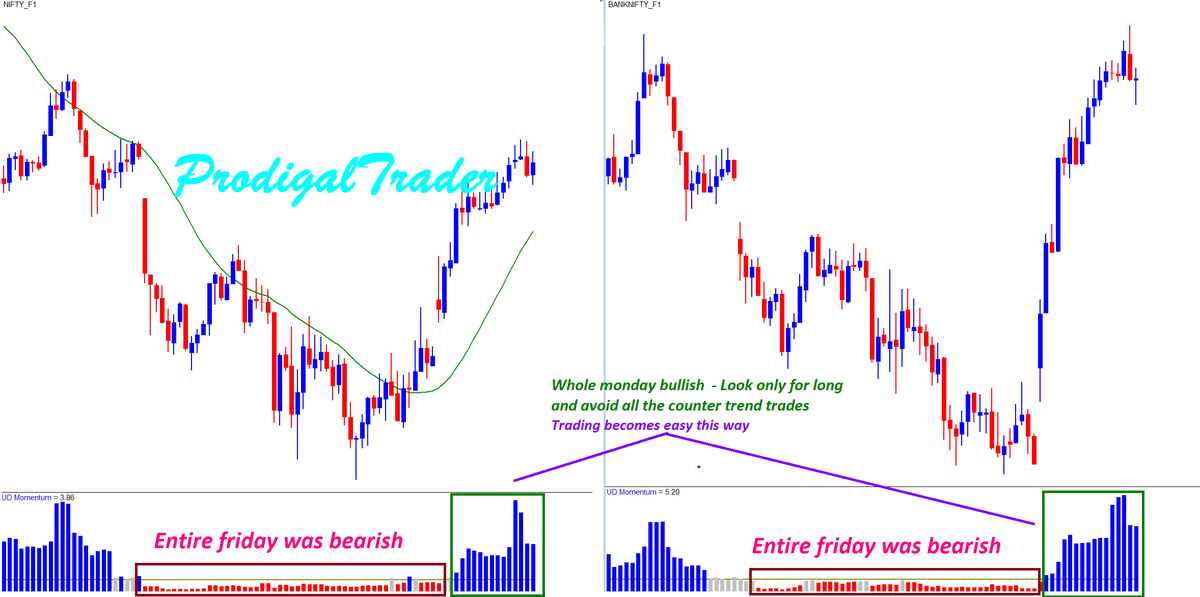
I have explained the importance of meeasuring momentum of the trend.
U can guage the strength in the trend once u know how to measure the direction.
This trend strength is infact signals the trend continuity or the potetnial for sustanining the trend.
Thats great assurace to hav https://t.co/HanLvlXkjQ
U can guage the strength in the trend once u know how to measure the direction.
This trend strength is infact signals the trend continuity or the potetnial for sustanining the trend.
Thats great assurace to hav https://t.co/HanLvlXkjQ
Before making ur trade entry or even before making a bias of trend as either bullish or bearish, do u use any objective measures to define the trend based on price, volume and momentum?
— Aneesh Philomina Antony (@ProdigalTrader) May 15, 2021
Price will always go back and forth move no matter how strong the trend is.
1/4 pic.twitter.com/qqizh2JO3J


1/n
Dear @chartmojo
Out of curiosity, just gone through your timeline and prepared a data of your shared tweets in OCT'2020;
You will not believe the following numbers:
Charts shared = 29 (2 excluded due to splits)
Period = 8-oct to 30-oct'20
..
2/n
If min.10k invested on your each design, then
Amount invested in Oct'20 = 2.91 lacs
Present investment value = 4.72 lacs
Maximum drawdown = 9%
ROI = 62% in 200 days
Annualized ROI = 147%
**You ROCK brother**
...
I've prepared a sheet for all your Oct'20 tweets; It was so much learning on the charts as well as on the data-part; Please keep on the good work.
Sheet link:
https://t.co/8BJtMsOkBD
With regards,
Deepak