Immediately post the market hours:
~ 2-3 hours to scan the charts
1 hr before the market opening:
~ re-visiting the existing holdings
~ revising the SL
~ prioritizing the watchlist in terms of the most promising setups
~ setting the alerts
More from The_Chartist 📈
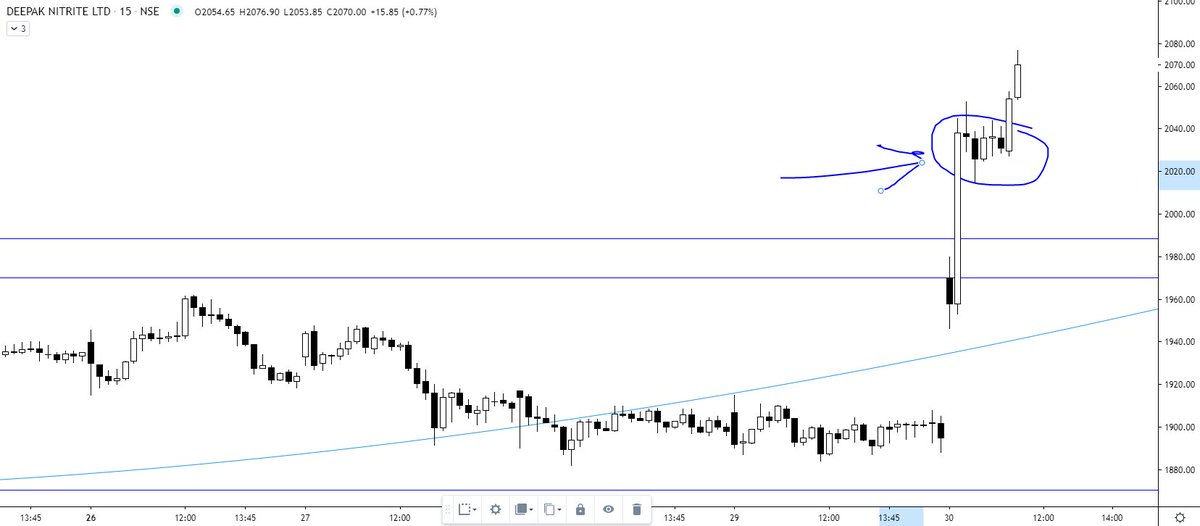
Deepak nitrite
Explained you same concept with Elxsi. The real test of a strong Breakout is that the big hand will not give you another chance to buy the share at the breakout level. They will absorb all the selling of weak hands. I mean "STRONG breakout". https://t.co/7fxFqGQl3p
Explained you same concept with Elxsi. The real test of a strong Breakout is that the big hand will not give you another chance to buy the share at the breakout level. They will absorb all the selling of weak hands. I mean "STRONG breakout". https://t.co/7fxFqGQl3p
Tata Elxsi ---
— Steve Nison (@nison_steve) June 30, 2021
In the last 10 minutes, all the selling was absorbed despite intraday positions being squared off (if not converted). will wait for the EOD data. However, the chart structure is extremely strong. https://t.co/pci7GCDBEO pic.twitter.com/1NBD9V3mKc
More from Screeners


VWAP for intraday Trading Part -2
A small thread.
PART 1 - https://t.co/ooxepHpYKL
Traders show your support by like & retweet to benefit all
@Mitesh_Engr @ITRADE191 @ProdigalTrader @nakulvibhor @RajarshitaS @Puretechnicals9 @AnandableAnand @Anshi_________ @ca_mehtaravi
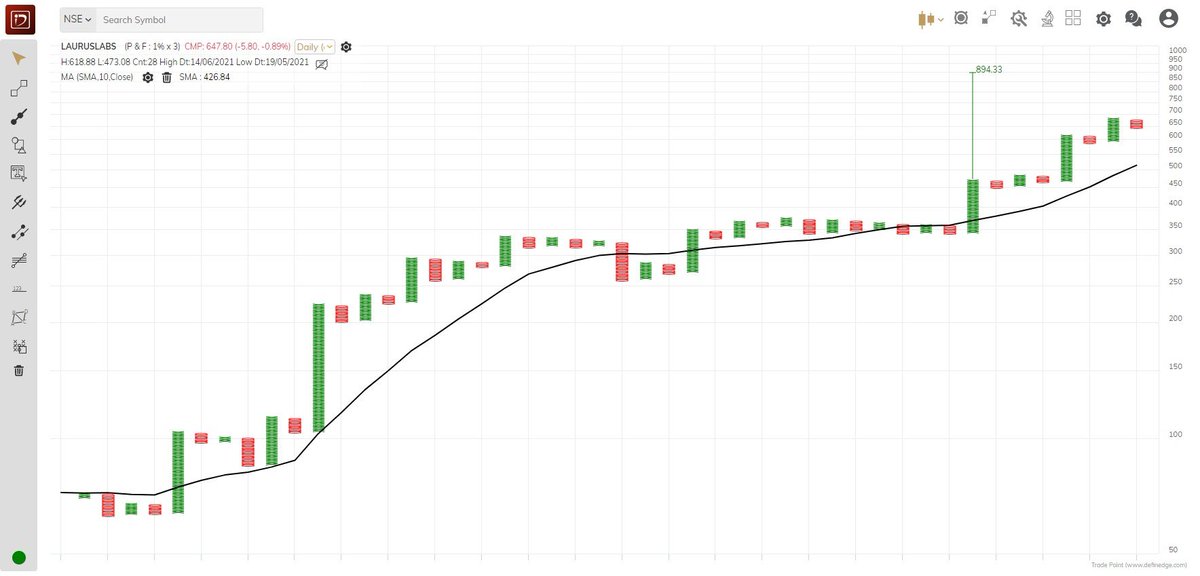
Chart 1
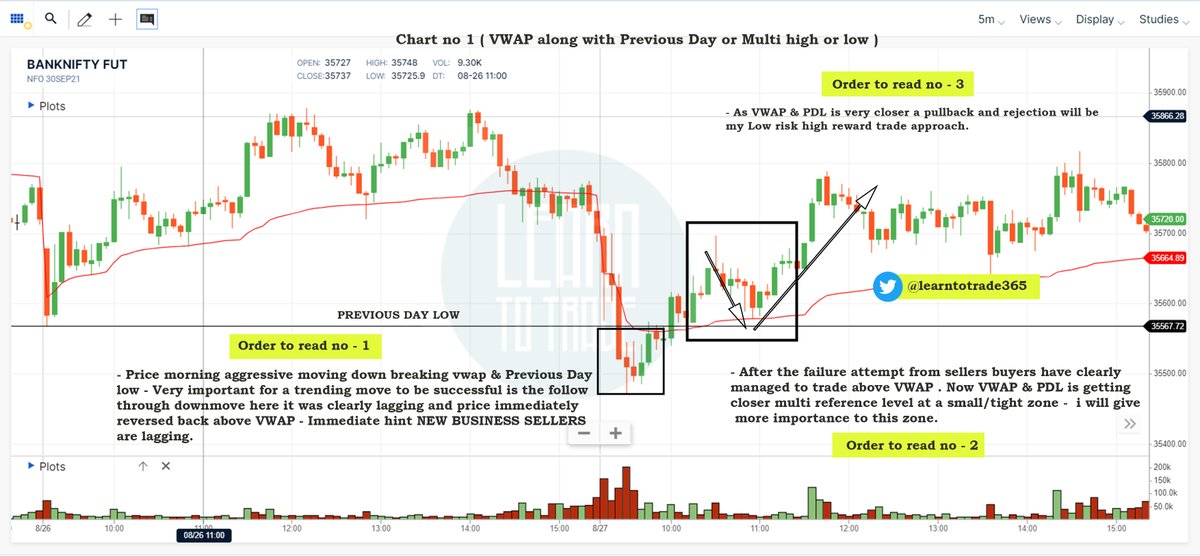
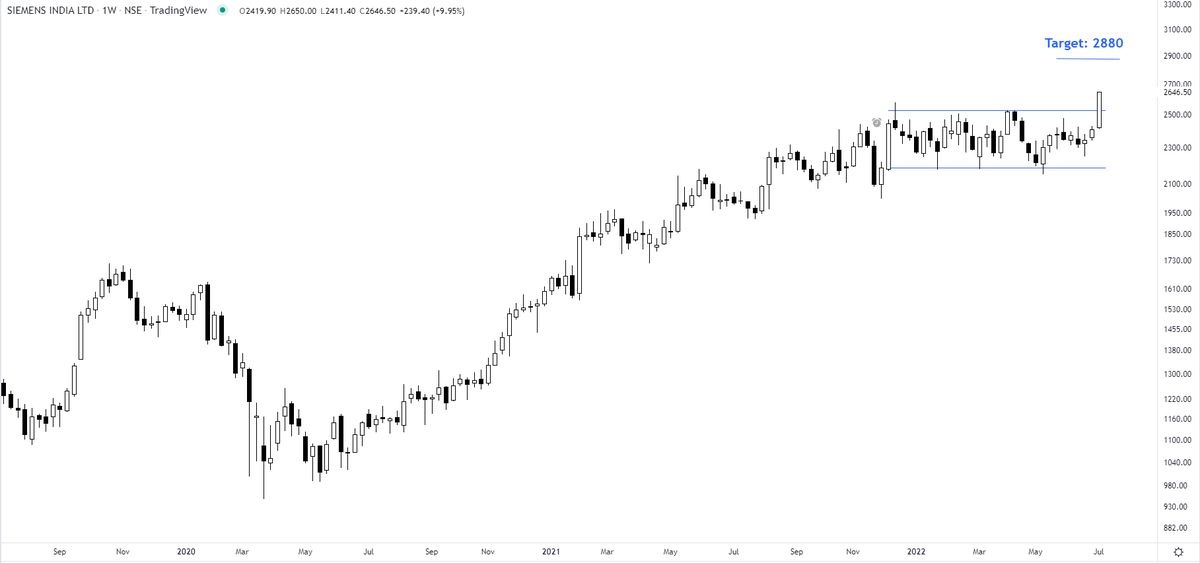
Chart 2
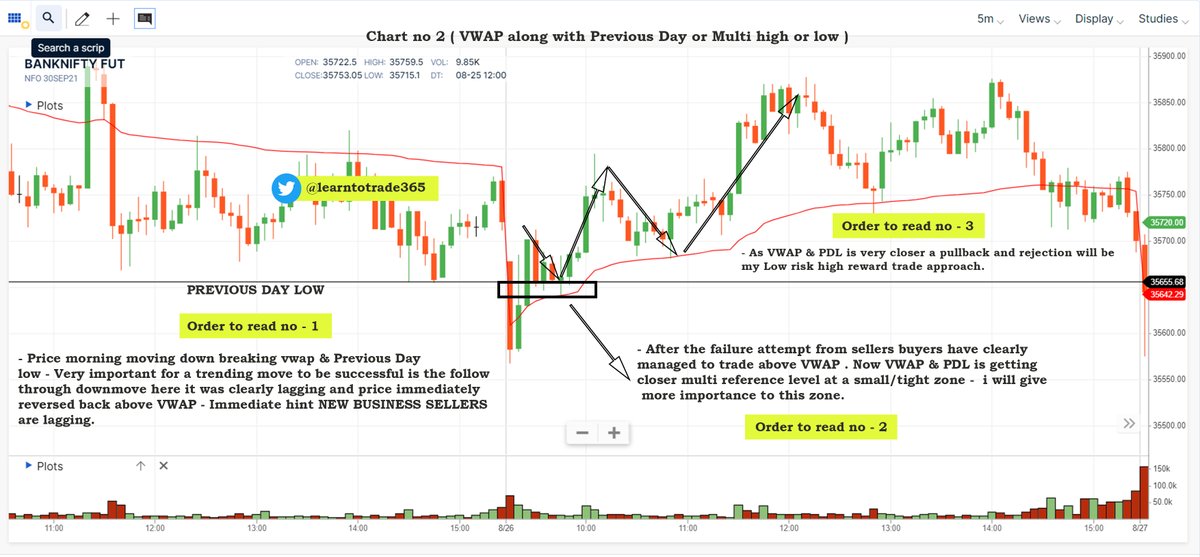
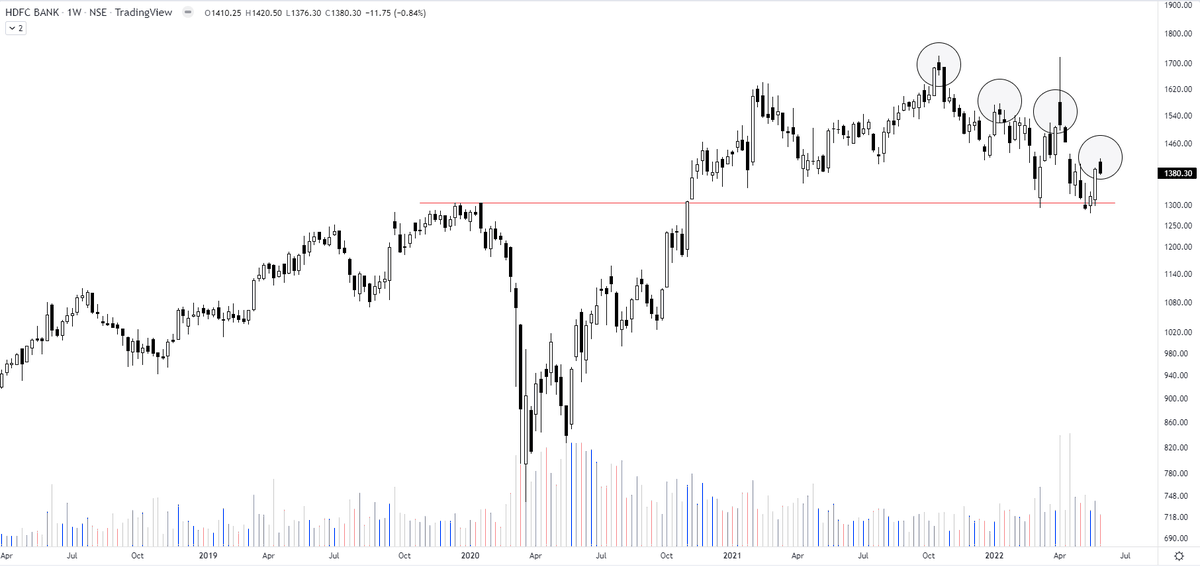
Chart 3
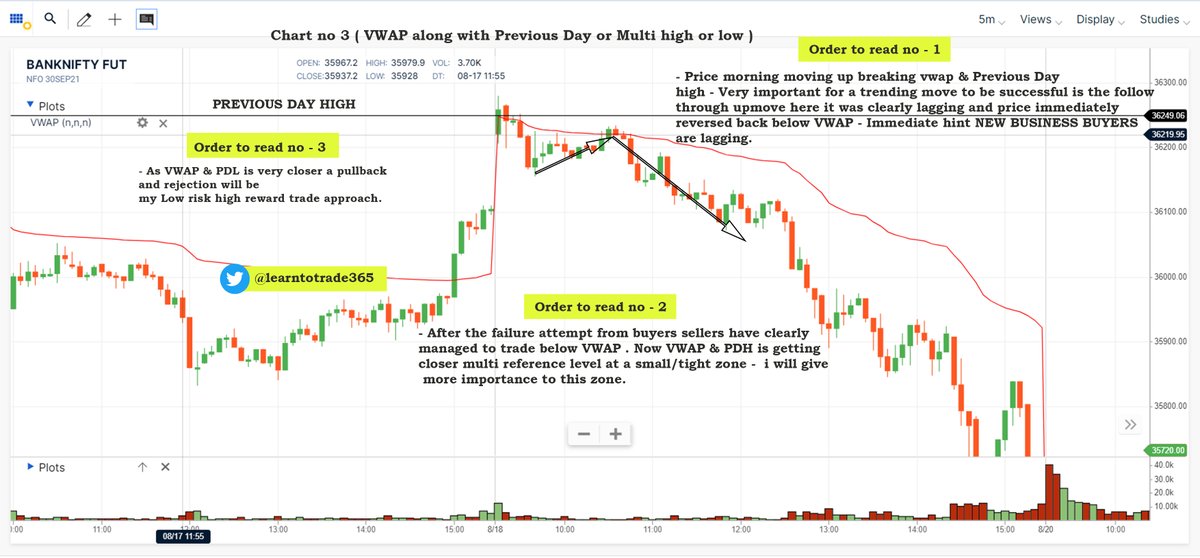
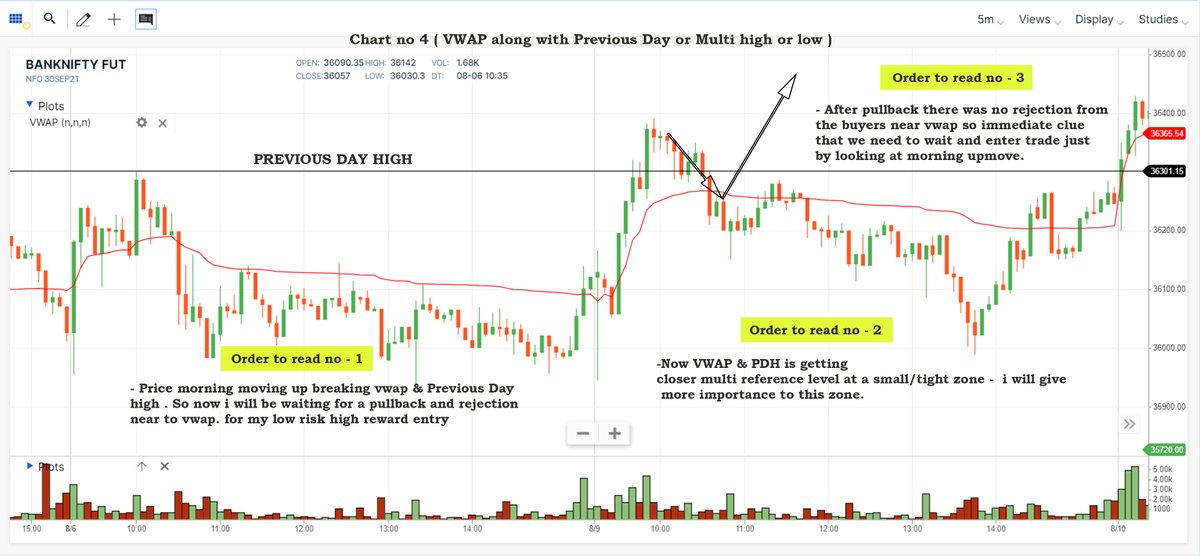
Chart 4
A small thread.
PART 1 - https://t.co/ooxepHpYKL
Traders show your support by like & retweet to benefit all
@Mitesh_Engr @ITRADE191 @ProdigalTrader @nakulvibhor @RajarshitaS @Puretechnicals9 @AnandableAnand @Anshi_________ @ca_mehtaravi
VWAP for intraday Trading Part -1
— Learn to Trade (@learntotrade365) August 28, 2021
A small thread PART -2 will be released tomorrow
Traders show your support by like & retweet to benefit all@Mitesh_Engr @ITRADE191 @ProdigalTrader @nakulvibhor @ArjunB9591 @CAPratik_INDIAN @RajarshitaS @Stockstudy8 @vivbajaj @Prakashplutus pic.twitter.com/y8bwisM4hB
Chart 1
Chart 2
Chart 3
Chart 4

Took me 5 years to get the best Chartink scanners for Stock Market, but you’ll get it in 5 mminutes here ⏰
Do Share the above tweet 👆
These are going to be very simple yet effective pure price action based scanners, no fancy indicators nothing - hope you liked it.
https://t.co/JU0MJIbpRV
52 Week High
One of the classic scanners very you will get strong stocks to Bet on.
https://t.co/V69th0jwBr
Hourly Breakout
This scanner will give you short term bet breakouts like hourly or 2Hr breakout
Volume shocker
Volume spurt in a stock with massive X times


You May Also Like


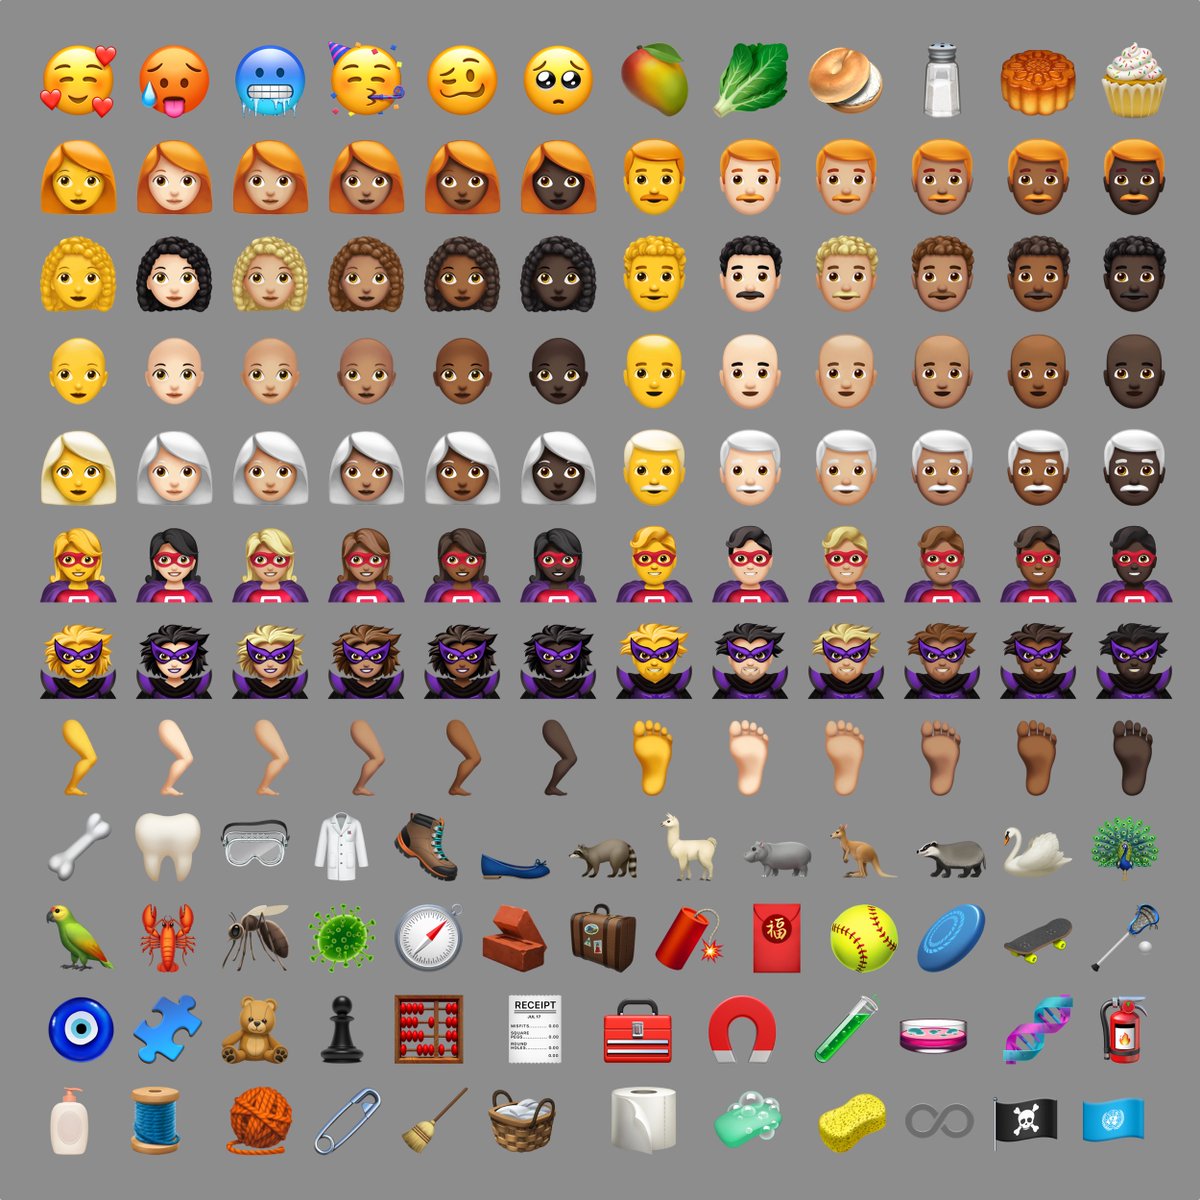
✨📱 iOS 12.1 📱✨
🗓 Release date: October 30, 2018
📝 New Emojis: 158
https://t.co/bx8XjhiCiB
New in iOS 12.1: 🥰 Smiling Face With 3 Hearts https://t.co/6eajdvueip

New in iOS 12.1: 🥵 Hot Face https://t.co/jhTv1elltB
New in iOS 12.1: 🥶 Cold Face https://t.co/EIjyl6yZrF

New in iOS 12.1: 🥳 Partying Face https://t.co/p8FDNEQ3LJ

🗓 Release date: October 30, 2018
📝 New Emojis: 158
https://t.co/bx8XjhiCiB
New in iOS 12.1: 🥰 Smiling Face With 3 Hearts https://t.co/6eajdvueip
New in iOS 12.1: 🥵 Hot Face https://t.co/jhTv1elltB
New in iOS 12.1: 🥶 Cold Face https://t.co/EIjyl6yZrF
New in iOS 12.1: 🥳 Partying Face https://t.co/p8FDNEQ3LJ