RSI- commonly used to show whether price is overbought or oversold.
General rule:
𝐑𝐒𝐈 > 𝟕𝟎 -- 𝐎𝐯𝐞𝐫𝐛𝐨𝐮𝐠𝐡𝐭
𝐑𝐒𝐈 < 𝟑𝟎 -- 𝐎𝐯𝐞𝐫𝐬𝐨𝐥𝐝
One becomes cautious once price becomes overbought and optimistic when price becomes oversold.
2/16


Stock Screeners is an integral part of doing homework post market hours.
— Yash Mehta (@YMehta_) August 5, 2022
Most of us use screeners to filter buzzing stocks out of 1000+ stock and it saves lot of times.
Here is the list of top screeners:
Also, last screener is one of my favourite to pick early momentum stocks.
Screeners helps trader in saving lot of time in filtering best stocks out of 1000+ stocks listed.
— Yash Mehta (@YMehta_) September 16, 2022
Here is the list of top 9 Free Price Action based screeners that I use:
Also, last screener is my favorite to pick early momentum stocks.
Screeners helps trader in saving lot of time in filtering best stocks out of 5000+ listed stocks.
— Yash Mehta (@YMehta_) October 7, 2022
Here is the list of top 7 Free Strategy and its respective screeners that I use:
Also, last screener is my favorite to pick early momentum stocks.
Taking this Intraday trade for today's expiry
— Yash Mehta (@YMehta_) February 2, 2023
Selling Nifty 17700 CE and Nifty 17500 PE
One can hedge it by buying OTM options to reduce margin or can go naked selling.
Stoploss: 17450/17750
Combined Premium of selling is 43 points pic.twitter.com/ga3hIoVTPC
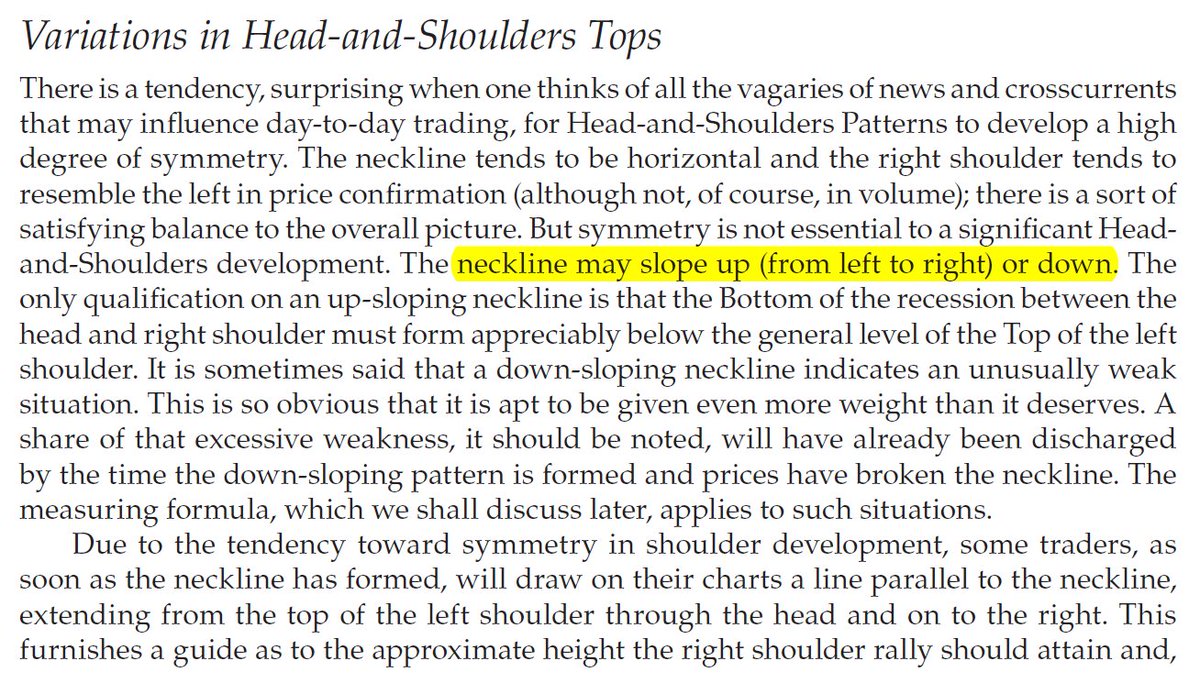
Sir Edwards & Magee discussed sloping necklines in H&S in their classical work. I am considering this breakdown by Affle as an H&S top breakdown with a target open of 770.
— The_Chartist \U0001f4c8 (@charts_zone) May 25, 2022
The target also coincides with support at the exact same level. pic.twitter.com/n84kSgkg4q
A THREAD:
— Aditya Todmal (@AdityaTodmal) November 28, 2020
7 FREE OPTION TRADING COURSES FOR BEGINNERS.
Been getting lot of dm's from people telling me they want to learn option trading and need some recommendations.
Here I'm listing the resources every beginner should go through to shorten their learning curve.
(1/10)
The absolute best 15 scanners which experts are using.
— Aditya Todmal (@AdityaTodmal) January 29, 2021
Got these scanners from the following accounts:
1. @Pathik_Trader
2. @sanjufunda
3. @sanstocktrader
4. @SouravSenguptaI
5. @Rishikesh_ADX
Share for the benefit of everyone.
12 TRADING SETUPS which experts are using.
— Aditya Todmal (@AdityaTodmal) February 7, 2021
These setups I found from the following 4 accounts:
1. @Pathik_Trader
2. @sourabhsiso19
3. @ITRADE191
4. @DillikiBiili
Share for the benefit of everyone.
Curated tweets on How to Sell Straddles
— Aditya Todmal (@AdityaTodmal) February 21, 2021
Everything covered in this thread.
1. Management
2. How to initiate
3. When to exit straddles
4. Examples
5. Videos on Straddles
Share if you find this knowledgeable for the benefit of others.