
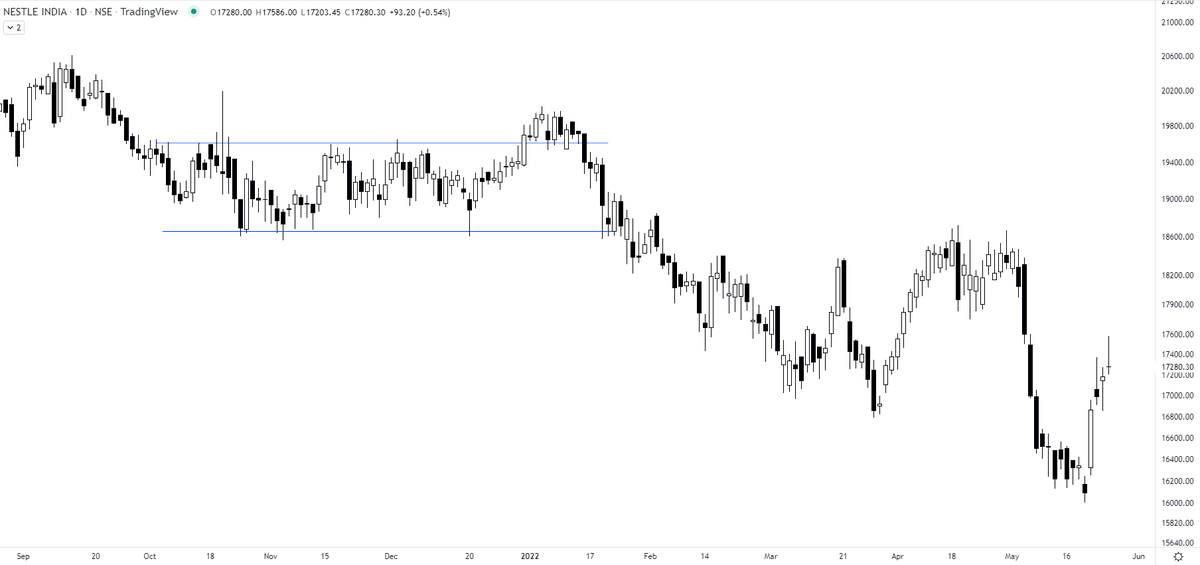
I highlighted the big selling volumes for you. Did I know the CEO will resign? No.
I just noticed the selling by informed insiders on the chart. And here you have the news with a LC.
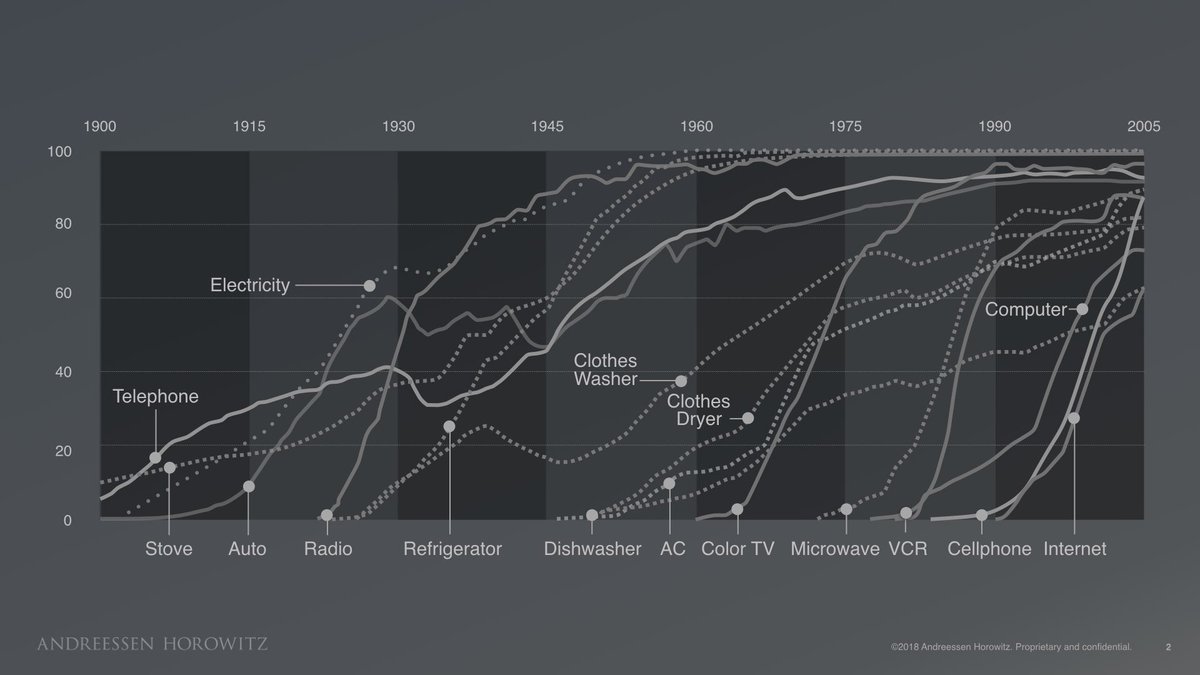
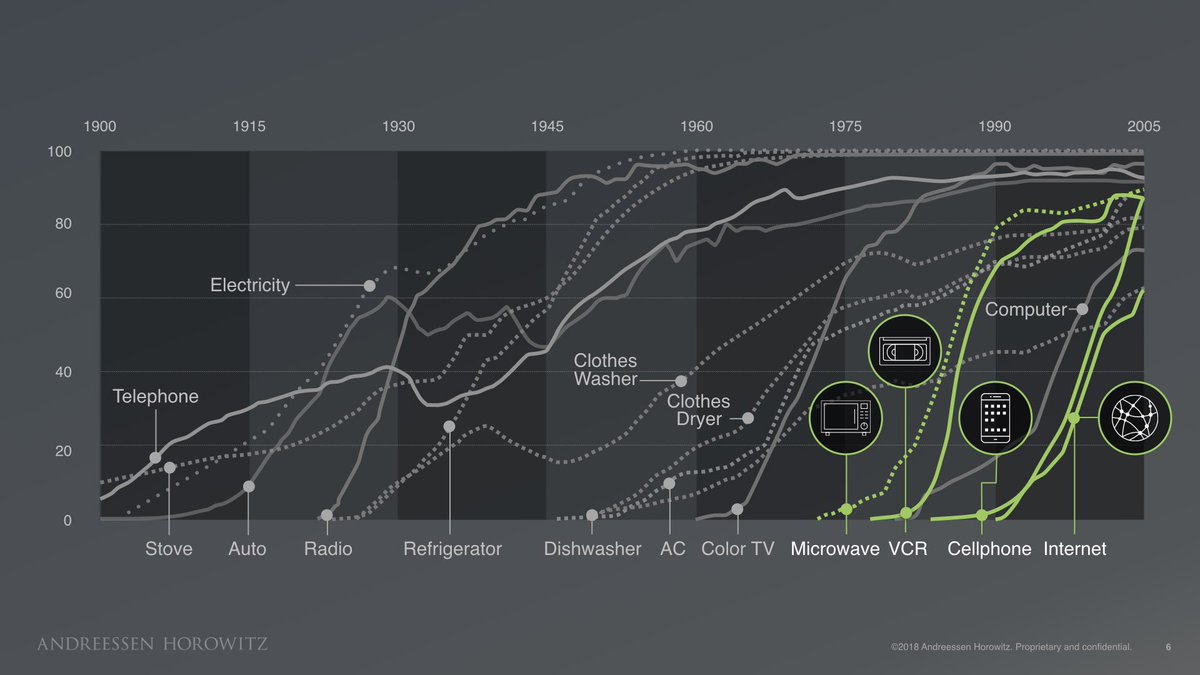
Ignore the charts at your own peril
Jubilant Foodworks https://t.co/E1C2eWrPHp
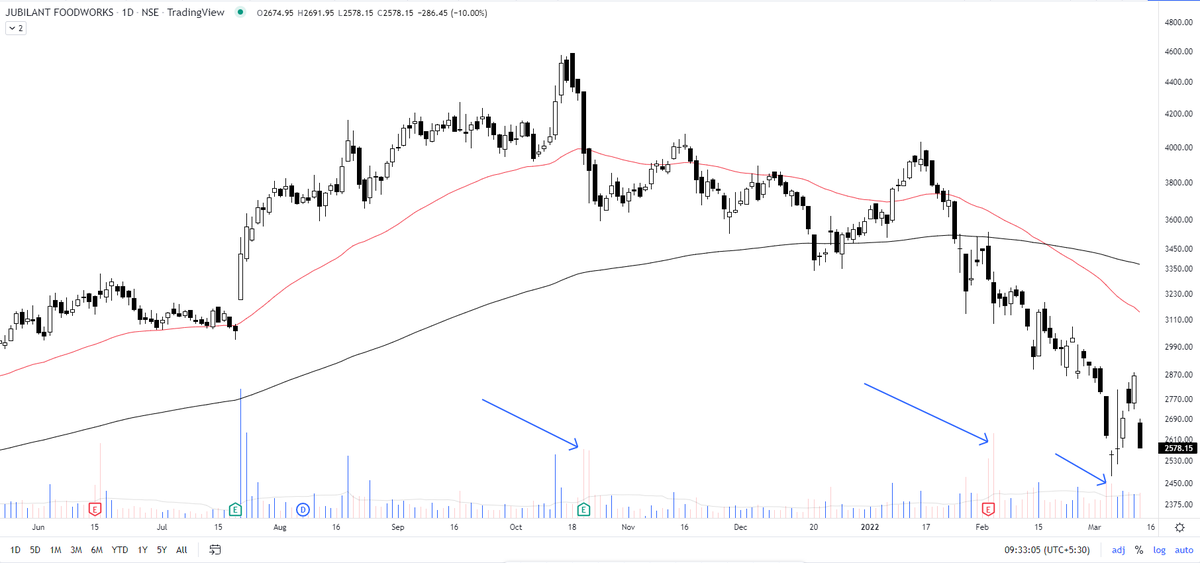
Jubilant Foodworks - The first thing I ask myself before jumping in is if the selling has been absorbed/exhausted. How?
— The_Chartist \U0001f4c8 (@charts_zone) March 4, 2022
~ price will fall down with fewer volumes
~ or price will stop forming fresh low
Till these conditions are met - NO SIP/no lump sum pic.twitter.com/FeJC849EYu
More from The_Chartist 📈

Syngene - Double Top triggered today after a triangle breakout. 1%*3 Box size and reversal. https://t.co/pBY2JOwhjN
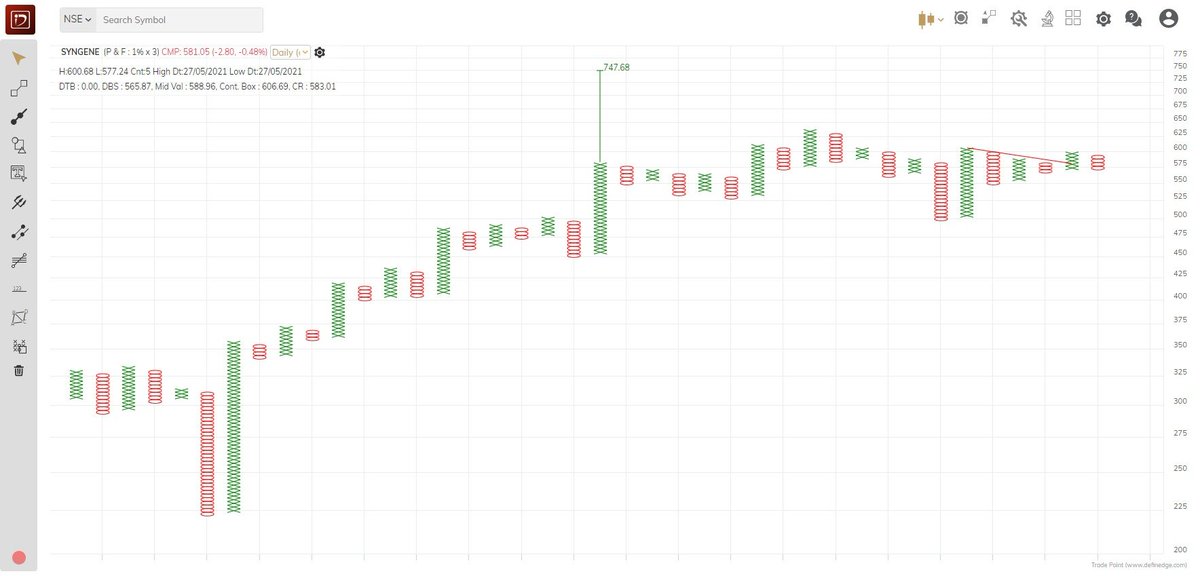
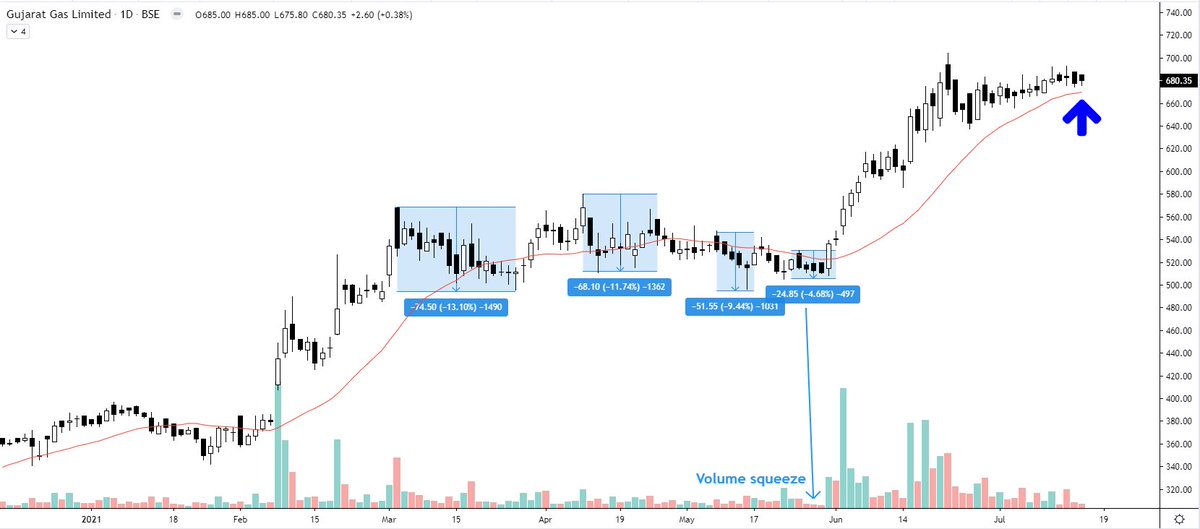
Syngene - Same concept. Price contraction. Shift from weak to strong hands through repeated volatility contractions. I can well write one whole page explanation on it. Look at the volume pump today. A big hand will never let you ride with him. Make sure you are there at the party https://t.co/RN8sQYzdBg pic.twitter.com/AShKWnQeJt
— Steve Nison (@nison_steve) July 15, 2021
More from Screeners


You May Also Like


Nano Course On Python For Trading
==========================
Module 1
Python makes it very easy to analyze and visualize time series data when you’re a beginner. It's easier when you don't have to install python on your PC (that's why it's a nano course, you'll learn python...
... on the go). You will not be required to install python in your PC but you will be using an amazing python editor, Google Colab Visit https://t.co/EZt0agsdlV
This course is for anyone out there who is confused, frustrated, and just wants this python/finance thing to work!
In Module 1 of this Nano course, we will learn about :
# Using Google Colab
# Importing libraries
# Making a Random Time Series of Black Field Research Stock (fictional)
# Using Google Colab
Intro link is here on YT: https://t.co/MqMSDBaQri
Create a new Notebook at https://t.co/EZt0agsdlV and name it AnythingOfYourChoice.ipynb
You got your notebook ready and now the game is on!
You can add code in these cells and add as many cells as you want
# Importing Libraries
Imports are pretty standard, with a few exceptions.
For the most part, you can import your libraries by running the import.
Type this in the first cell you see. You need not worry about what each of these does, we will understand it later.