This course is for anyone out there who is confused, frustrated, and just wants this python/finance thing to work!
Nano Course On Python For Trading
==========================
Module 1
Python makes it very easy to analyze and visualize time series data when you’re a beginner. It's easier when you don't have to install python on your PC (that's why it's a nano course, you'll learn python...
This course is for anyone out there who is confused, frustrated, and just wants this python/finance thing to work!
# Using Google Colab
# Importing libraries
# Making a Random Time Series of Black Field Research Stock (fictional)
Intro link is here on YT: https://t.co/MqMSDBaQri
Create a new Notebook at https://t.co/EZt0agsdlV and name it AnythingOfYourChoice.ipynb
You got your notebook ready and now the game is on!
You can add code in these cells and add as many cells as you want
Imports are pretty standard, with a few exceptions.
For the most part, you can import your libraries by running the import.
Type this in the first cell you see. You need not worry about what each of these does, we will understand it later.
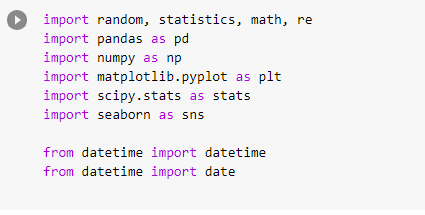
Once you have imported the packages, run the code by clicking on the play button ▶️.
Let's add some more code and create a fictional stock price chart of a multinational investment management firm Black Field Research (aka @BlackFieldRes ) and use it for statistics and graphs.
Exact Code:
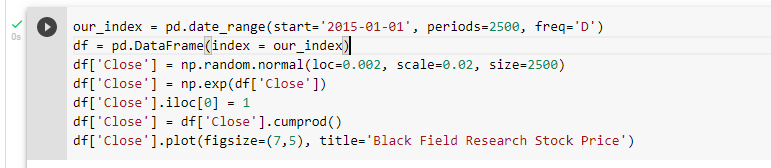
First, make the index of our data using "date_range." I picked today’s date, 2015/01/01, as the start date, used a daily frequency, and created 2500 rows.

1. Idea is to will the data frame with normal redistribute random numbers for our close price
2. Its mean is 0.002 and the standard deviation is 0.02. Total 2500 entries have been made.
3. Call above array as N, Replace N by..
4. Take the first row as 1, which is our stock price on day 1.
5. Finally, take the cumulative product of the columns.
It's fine if you didn't understand this. We will come on it in later posts. Let's see the output in the next post

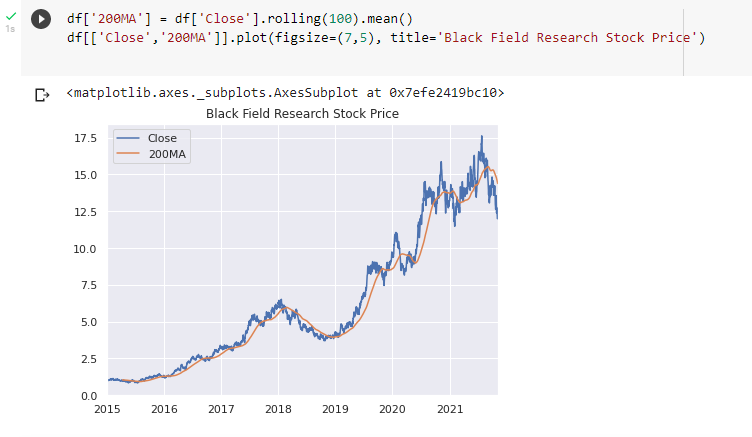

Add this code and the output will look like :
# Visualing Logical conditions as signals
# Simulating a trading strategy and considering slippages
I got you started with python. Meanwhile, learn about python and the terms we have used here. You can comment below with doubts.
https://t.co/wuremRtH1S
You can make a copy of it and play around with it.
Until next time.
More from Python

Nano Course On Python For Trading
==========================
Module 4
In this post, I will attempt to teach you how to write a trading strategy in Equity Segment that runs on your PC and create a Telegram bot that sends you buy/sell signals with Stop Loss.
Prerequisite: If you hadn't gone through the earlier modules, I strongly recommend you go through them all. Module 2: https://t.co/pciDOJXyVI
Note:
If you liked my content, you can donate, tip and support me on this link (any amount you prefer)
We are going to implement below strategy:
Rules: There should be three candles -> high of candle 1 > high of candle 2 > high of candle 3 and low of candle 1 < low of candle 2 < low of candle 3, where candle 3 is T-1 day, candle 2 is T-2 day and candle 1 is of T-3 Day, T = today.
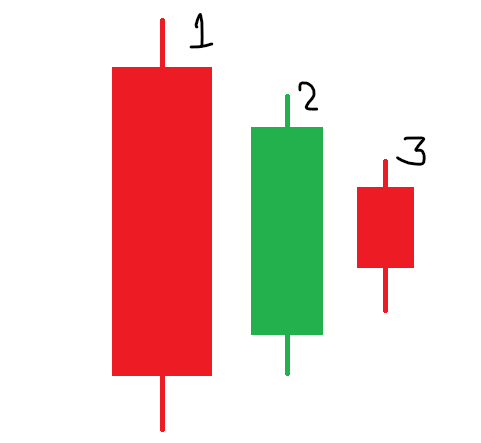
If on today(day=T), the stock crosses yesterday high(candle 3), then send a buy signal to your telegram handle with candle 3 low as SL.
Before we get started with code, let's create a telegram bot using BotFather.
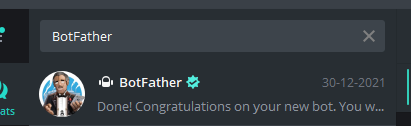
Step 1: Search BotFather in the telegram.
Step 2: type /newbot and then give the name to your bot. Refer to the second image as an example
==========================
Module 4
In this post, I will attempt to teach you how to write a trading strategy in Equity Segment that runs on your PC and create a Telegram bot that sends you buy/sell signals with Stop Loss.
Nano Course On Python For Trading
— Indian Quant \U0001f1ee\U0001f1f3 (@indian_quant) December 13, 2021
==========================
Module 1
Python makes it very easy to analyze and visualize time series data when you\u2019re a beginner. It's easier when you don't have to install python on your PC (that's why it's a nano course, you'll learn python...
Prerequisite: If you hadn't gone through the earlier modules, I strongly recommend you go through them all. Module 2: https://t.co/pciDOJXyVI
Note:
If you liked my content, you can donate, tip and support me on this link (any amount you prefer)
Nano Course On Python For Trading
— Indian Quant \U0001f1ee\U0001f1f3 (@indian_quant) December 13, 2021
==========================
Module 1
Python makes it very easy to analyze and visualize time series data when you\u2019re a beginner. It's easier when you don't have to install python on your PC (that's why it's a nano course, you'll learn python...
We are going to implement below strategy:
Rules: There should be three candles -> high of candle 1 > high of candle 2 > high of candle 3 and low of candle 1 < low of candle 2 < low of candle 3, where candle 3 is T-1 day, candle 2 is T-2 day and candle 1 is of T-3 Day, T = today.
If on today(day=T), the stock crosses yesterday high(candle 3), then send a buy signal to your telegram handle with candle 3 low as SL.
Before we get started with code, let's create a telegram bot using BotFather.
Step 1: Search BotFather in the telegram.
Step 2: type /newbot and then give the name to your bot. Refer to the second image as an example


You May Also Like

Krugman is, of course, right about this. BUT, note that universities can do a lot to revitalize declining and rural regions.
See this thing that @lymanstoneky wrote:
And see this thing that I wrote:
And see this book that @JamesFallows wrote:
And see this other thing that I wrote:
One thing I've been noticing about responses to today's column is that many people still don't get how strong the forces behind regional divergence are, and how hard to reverse 1/ https://t.co/Ft2aH1NcQt
— Paul Krugman (@paulkrugman) November 20, 2018
See this thing that @lymanstoneky wrote:
And see this thing that I wrote:
And see this book that @JamesFallows wrote:
And see this other thing that I wrote: