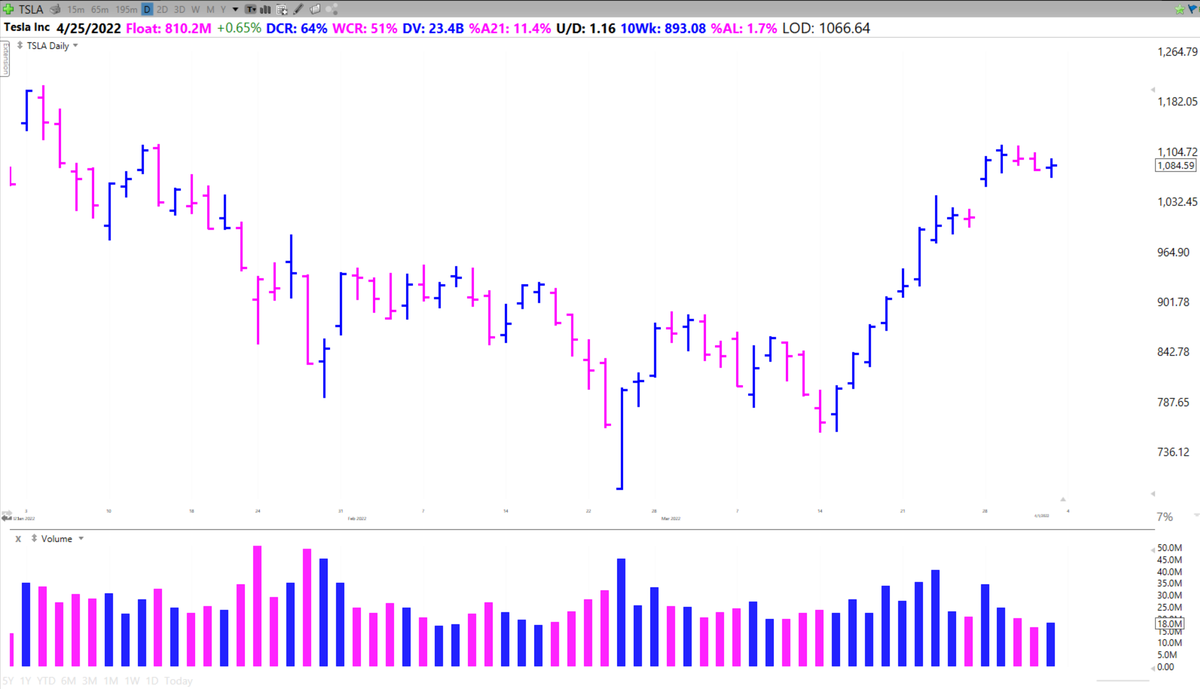
Technical Green Flags
Gap up after Earnings
Relative Strength vs the market
Higher Highs, lows
Retaking MAs
Respect for logical support
Stage 2 Uptrend
Breakouts through resistance on HV
Pocket Pivots
Strong DCRs
Orderly price action
Near or at ATHs
Weekly Vol Spikes
What else?
More from Richard Moglen 🦁
(And how to find them)
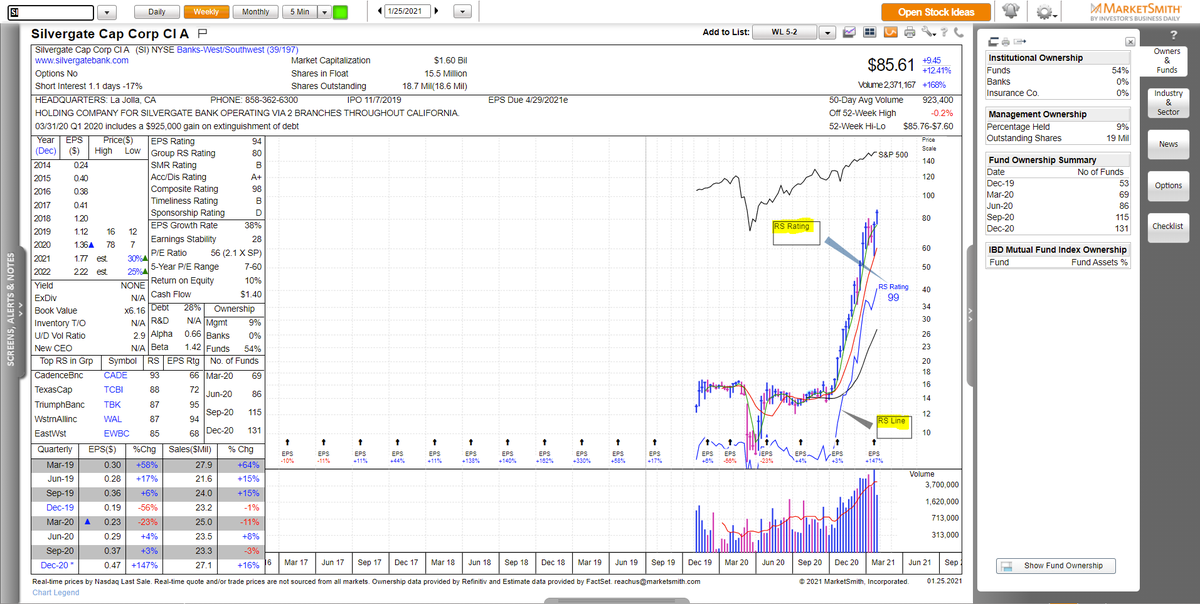
In one sentence a TML is an institutional quality stock in a leading industry group with superior fundamentals and technicals
These are monster stocks which over the course of weeks and months increase +100% to +5,000%
TMLs are popular with traders/investors whose methodology is based on the CANSLIM system developed by William O'Neil.
He called them Model Book Stocks. Huge winners worth studying to identify common characteristics that they all share
O'Neil studied over 1000 model book stocks going back to the 1880s.
Many are shown and discussed in these must read books
How To Make Money in Stocks, O"Neil
https://t.co/S2sShZedUm
Monster Stocks, John Boik @monsterstocks1
A Few Examples courtesy of @SystematiCK_
Pic N Save
#Study & #learn from past super #stocks
— SystematiCK Trader (@SystematiCK_) September 26, 2020
Example 22: Pic N Save - 1979
Sharpen your eyes & internalize
- which fundamental and technical setup fuelled the big gain
- how trade management was done
- the importance of acc./distr. volume
Credit to the great W. O\u2019Neil! pic.twitter.com/m888ZaGyMV



More from Screeners





What does it mean?
7 tweets that will teach you about its basics (and much more):🧵
Collaborated with @niki_poojary
1/ What is CPR?
The basics of CPR, how it's calculated, and TC and BC in CPR.
User: @ZerodhaVarsity.
One can also gauge the trend whether bullish or bearish.
Explained in very simple words
@ZerodhaVarsity 2/ What are the Uses of CPR?
User: @YMehta_
A thread that provides examples along with the concept.
Also includes an Intraday Trading Setup on 5 min
#CPR is an indicator which is used for #Intraday in Stock Market.
— Yash Mehta (@YMehta_) November 19, 2021
This learning thread would be on
"\U0001d650\U0001d668\U0001d65a\U0001d668 \U0001d664\U0001d65b \U0001d63e\U0001d64b\U0001d64d"
Like\u2764\ufe0f& Retweet\U0001f501for wider reach and for more such learning thread in the future.
Also, an investment strategy is shared using CPR in the end.
1/24
@ZerodhaVarsity @YMehta_ 3/ How to analyze trends with CPR?
User: @cprbykgs
How to interpret CPR based on the candles forming either above or below the daily and weekly CPR.
He is the most famous guy when it comes to CPR, so go through his Twitter and Youtube
CPR indicator trend analysis:
— Gomathi Shankar (@cprbykgs) January 25, 2022
Candles below daily & weekly CPR \U0001f43b
Candles above daily CPR but below weekly CPR early confirmation of \U0001f402
Candles above daily + weekly CPR strong confirmation of \U0001f402
Isn\u2019t it simple?#cprbykgs #cprindicator #nifty #banknifty
@ZerodhaVarsity @YMehta_ @cprbykgs 4/ Interpreting longer timeframes with CPR
User: @cprbykgs
Trend Reversals with CPR when the trend is bullish and it enters the daily CPR
#banknifty
— Gomathi Shankar (@cprbykgs) July 9, 2021
Candles above monthly CPR- Bullish
Candles above weekly CPR- Bullish
Now, whenever candles enter daily CPR range it indicates weakness of current trend & early signs of trend reversal.
So, wait for the candles to exit the daily CPR range then take the trade. (1/4) pic.twitter.com/7vaaLMCrV8
You May Also Like








This New York Times feature shows China with a Gini Index of less than 30, which would make it more equal than Canada, France, or the Netherlands. https://t.co/g3Sv6DZTDE
That's weird. Income inequality in China is legendary.
Let's check this number.
2/The New York Times cites the World Bank's recent report, "Fair Progress? Economic Mobility across Generations Around the World".
The report is available here:
3/The World Bank report has a graph in which it appears to show the same value for China's Gini - under 0.3.
The graph cites the World Development Indicators as its source for the income inequality data.

4/The World Development Indicators are available at the World Bank's website.
Here's the Gini index: https://t.co/MvylQzpX6A
It looks as if the latest estimate for China's Gini is 42.2.
That estimate is from 2012.
5/A Gini of 42.2 would put China in the same neighborhood as the U.S., whose Gini was estimated at 41 in 2013.
I can't find the <30 number anywhere. The only other estimate in the tables for China is from 2008, when it was estimated at 42.8.